The Week Ahead: US JOLTS and jobs report, Broadcom earnings

CMC Markets
5 minute read
|31 Aug 2026
Birds eye view Eccles Building, Federal Reserve
Table of contents
  • 1.
    US JOLTS
  • 2.
    Broadcom Q3 earnings
  • 3.
    US jobs report
  • 4.
    Economic & company events calendar

The start of September will bring a range of economic data that could be important in determining the Federal Open Market Committee’s (FOMC) next monetary policy move ahead of its mid-month meeting. Labour-market reports include the job openings and labour turnover survey (JOLTS), the ADP employment change, plus the US non-farm payrolls and unemployment rate. Additionally, ISM manufacturing and services readings will provide insight into the state of the US economy. Earnings remain in focus, with AI chipmaking heavyweight Broadcom due to report third-quarter results.

US JOLTS

Tuesday 1 September

The number of job openings may attract more attention given its recent rise. Analysts expect job openings in July to fall to 7.273m from 7.359m. JOLTS is often difficult for analysts to predict, but the important consideration is the ratio of job openings to unemployed workers. The ratio reached its highest level since January 2025 in June, suggesting that the labour market may be tightening. A strong JOLTS reading might increase pressure on the Federal Reserve to consider raising interest rates.

EUR/USD may be particularly sensitive to the release. A strong reading could reverse the recent period of dollar weakness, pushing EUR/USD lower. The pair is currently trading near support at its 10-day exponential moving average, which has held since late July. A break below support may trigger a decline towards $1.15. On the upside, gains may be limited by the upper Bollinger Band® potentially serving as resistance, particularly with the relative strength index close to 70.

EUR/USD, September 2025 – present
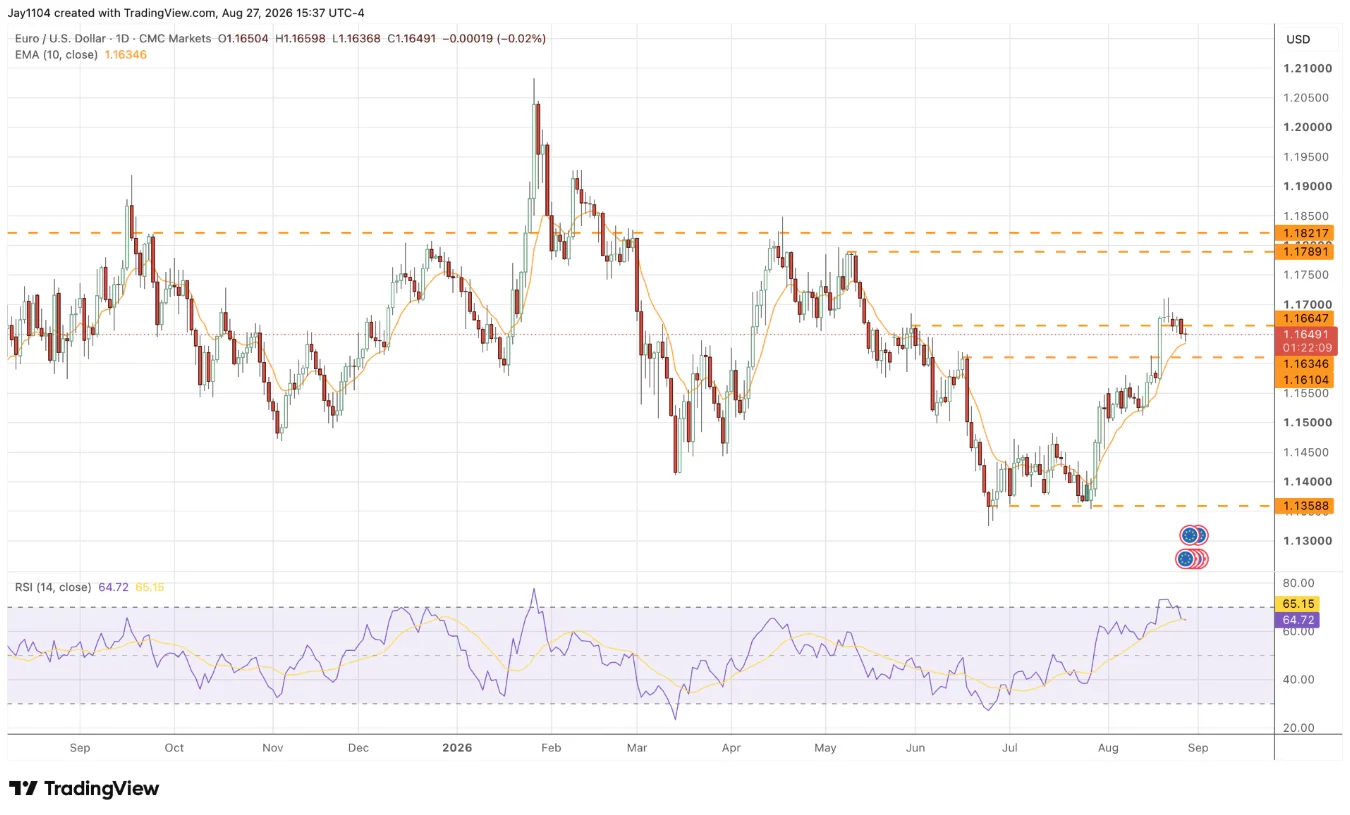
EUR/USD, September 2025 – present

Sources: TradingView, Michael Kramer

Broadcom Q3 earnings

Wednesday 2 September

The NASDAQ-listed semiconductor company is forecast to report fiscal third-quarter 2026 earnings growth of 91.5% to $3.24 a share, driven by revenue growth of 84.1% to $29.4bn. Revenue from the company’s semiconductor solutions segment is forecast to more than double, rising from $9.2bn last year to $18.5bn. Analysts expect the company to forecast Q4 earnings growth of 98.8% to $3.88 a share, with revenue growth of 94.5% to $35.03bn. Semiconductor solutions revenue is expected to more than double to $23.5bn.

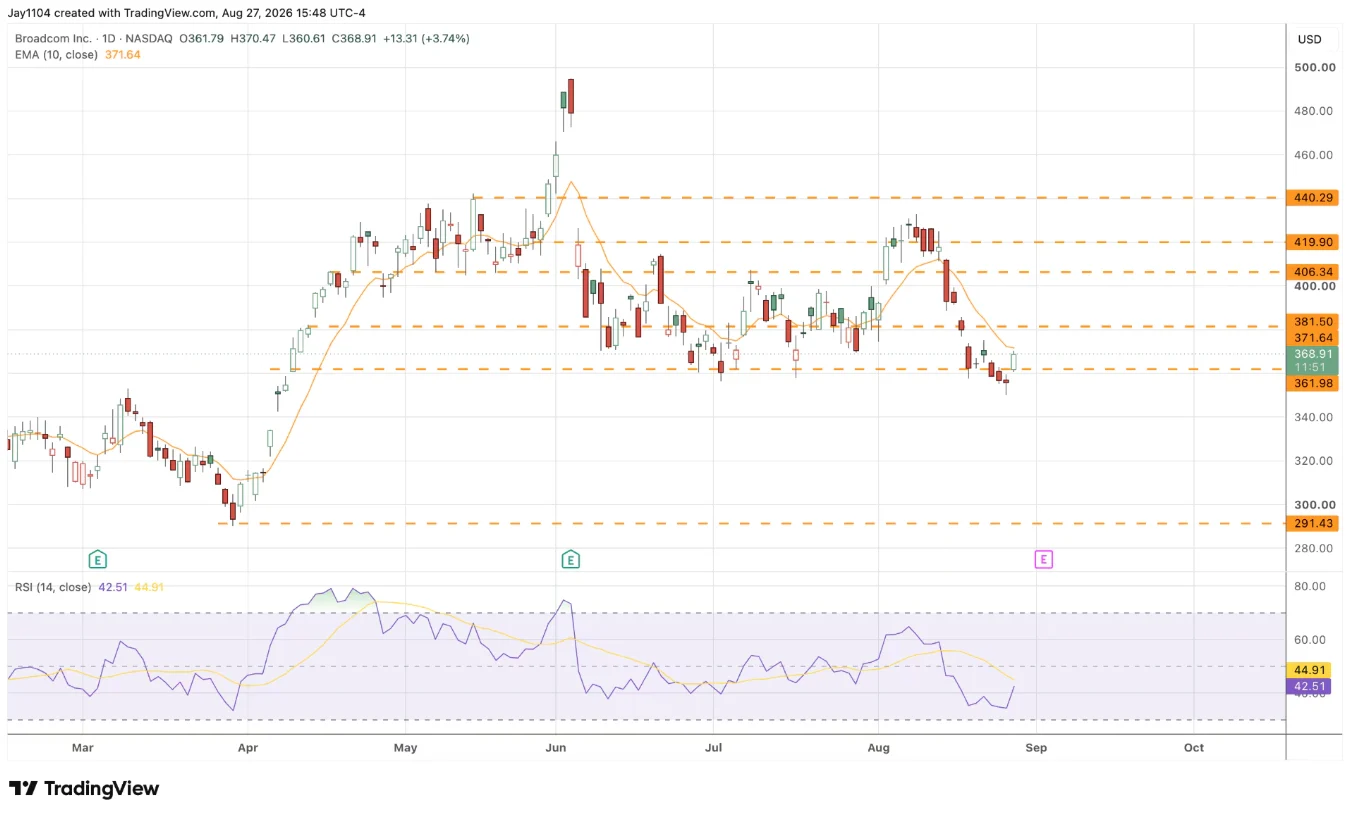
The options market is pricing in an approximate 7.6% post-earnings move in either direction. Options positioning appears neutral, suggesting hedging flows may not play much of a role in the post-earnings move. Options gamma positioning reveals strong support at the $350 strike and strong resistance at the $400 strike price.

The technical picture shows much the same, although with the stock currently pinned between the 10-day exponential moving average and technical support around $370, the stock finds itself trading much closer to the lower end of its trading range. A break of technical support at $360 could lead to the shares testing the lower options support level at $350. Conversely, if the stock breaks above its 10-day exponential moving average, it may have room to run higher.

Broadcom share price, March – present

Broadcom share price, March – present

Sources: TradingView, Michael Kramer

US jobs report

Friday 4 September

Analysts expect non-farm payrolls to rise by 60,000 in August, following a decline of 23,000 in July. The unemployment rate is forecast to rise to 4.2% from 4.1%, while wages are expected to grow by 0.2% month-on-month, up from 0.1%.

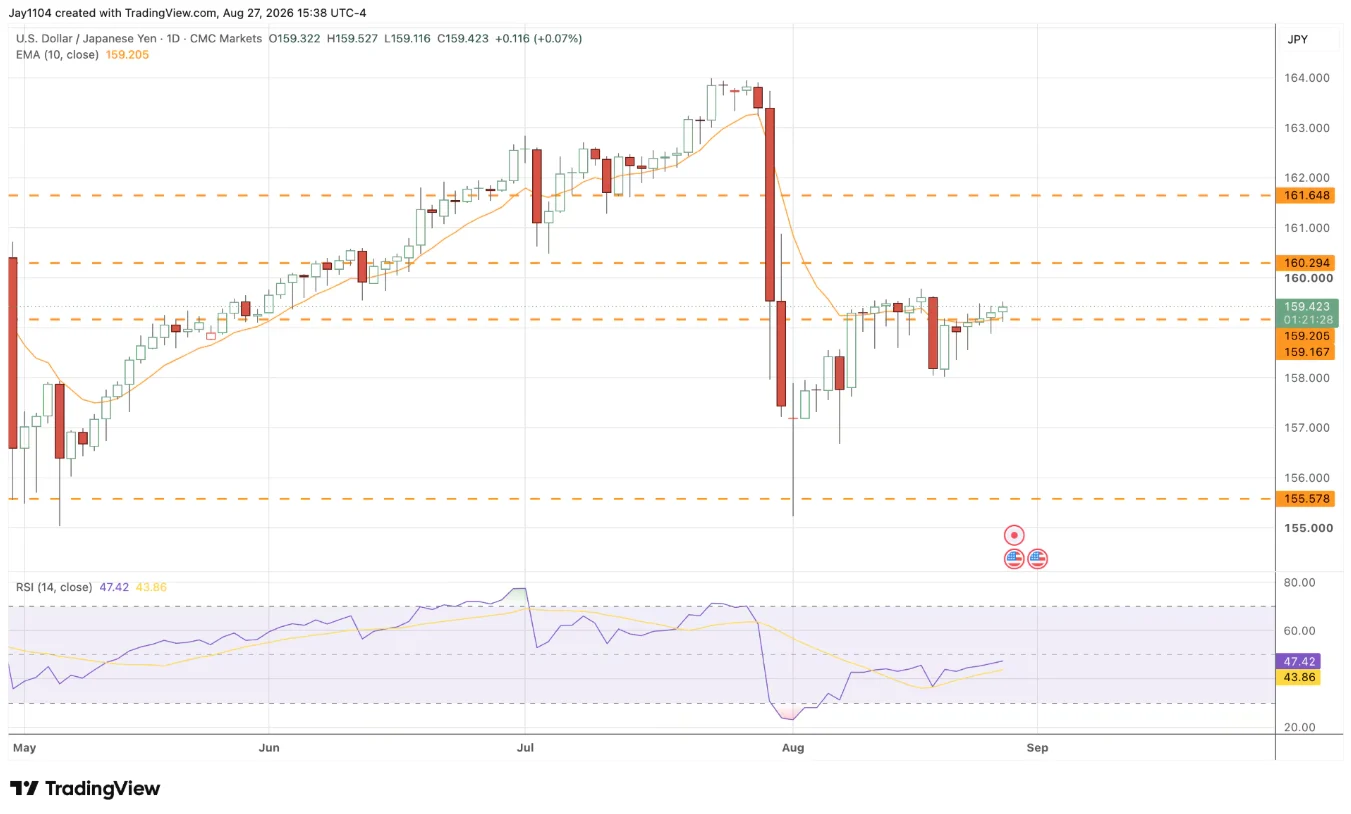
USD/JPY could be particularly sensitive to this data given the uncertainty around monetary policy in both countries. A hotter-than-expected jobs report could support the dollar and put further pressure on the yen.

USD/JPY has been hugging the 10-day exponential moving average since reaching it in mid-August. That moving average has largely been the support/resistance zone for the currency pair and has been unable to separate from it. A stronger-than-expected report may be needed to catapult USD/JPY higher and push it above $160, while a weaker report could send USD/JPY lower towards the intervention range near $157.

USD/JPY, May – present

USD/JPY, May – present

Sources: TradingView, Michael Kramer

Economic & company events calendar

Major scheduled data releases, plus other listed company results:

Monday 31 August
Germany: August flash consumer price index (CPI)
Japan: July industrial production, July retail trade
UK: Bank holiday
Results: Cango (Q2), LexinFintech (Q2), Science Applications (Q2), So-Young (Q2)

Tuesday 1 September
Eurozone: August flash CPI, July unemployment rate
UK: August S&P global manufacturing purchasing managers’ index (PMI), July mortgage approvals
US: August ISM manufacturing PMI, July JOLTS job openings
Results: Ashtead (HY), Bunzl (HY), Credo (Q1), Dell (Q2), GitLab (Q2), Michelmersh (HY), MongoDB (Q2), Palo Alto (Q4), Pennant (HY)

Wednesday 2 September
Australia: Q2 GDP
New Zealand: RBNZ interest-rate decision
US: August ADP employment change, Federal Reserve Beige Book
Results: Broadcom (Q3), Brown-Forman (Q1), Ecora Royalties (HY), HPE (Q3), NetApp (Q1), Snowflake (Q2), TT Electronics (HY)

Thursday 3 September
UK: August S&P global services and PMIs
US: August Challenger job cuts, August ISM services PMI
Results: Brooks Macdonald (FY), Docusign (Q2), Eurocell (HY), Guidewire (Q4), Hilton Food (HY), M&G (HY), Rosebank Industries (HY), Samsara (Q2), The Toro Company (Q3), Zscaler (Q4)

Friday 4 September
Eurozone: July retail sales
Germany: July factory orders
UK: August S&P global construction PMI, Bank of England’s Governor Bailey speech
US: August average earnings, August non-farm payrolls, August unemployment rate
Results: CT Private Equity Trust (HY), Knot Offshore Partners (Q2)

Disclaimer: This article provides general information only. It has been prepared without taking account of your objectives, financial situation or needs. It is not to be construed as a solicitation or an offer to buy or sell any financial instruments, or as a recommendation and/or investment advice. It does not intend to support an investment decision and it should not be relied upon by you in evaluating the merits of investing in any financial instruments. You should consider your objectives, financial situation and needs before acting on the information in this article. CMC Markets believes that the information in this article is correct, and any opinions and conclusions are reasonably held or made on information available at the time of its compilation, but no representation or warranty is made as to the accuracy, reliability or completeness of any statements made in this article. CMC Markets is under no obligation to, and does not, update or keep current the information contained in this article. Neither CMC Markets nor any of its affiliates or subsidiaries accepts liability for loss or damage arising out of the use of all or any part of this article. Any opinions or conclusions set forth in this article are subject to change without notice and may differ or be contrary to the opinions or conclusions expressed by any other members of CMC Markets.