Price volume analysis is to first evaluate the on balance volume (OBV) indicator to gauge trading volume, which is a cumulative total of the number of shares traded each day, adding the shares when price is higher and subtracting it when price goes down.
Ideally, we want to see on balance volume confirming the trend in price. When a security is moving higher and the OBV indicator is moving up as well we can conclude demand is healthy with a positive flow on up days compared to down. When net-volume begins to diverge from price, as a result of more shares repeatedly being traded on negative days, it can provide a possible signal in your analysis that the volume profile is no longer supportive of the current trend in price.
This volume divergence is something we’re seeing right now in U.S. equities, specifically the S&P 500 and Nasdaq 100. I’ll be focusing on the PowerShares Nasdaq-100 QQQ.
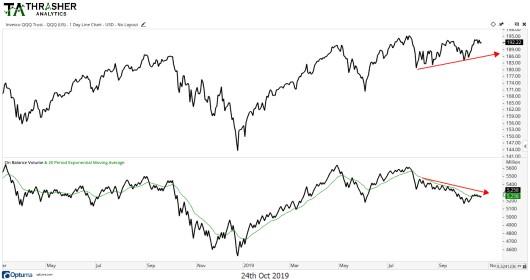
Here’s the current OBV and QQQ chart. Since the Nasdaq began recovering off its summer decline, net-volume has yet to show signs of confirmation over the last 60 days. We can now look at previous times in recent market history where correlation between OBV and QQQ has broken down.
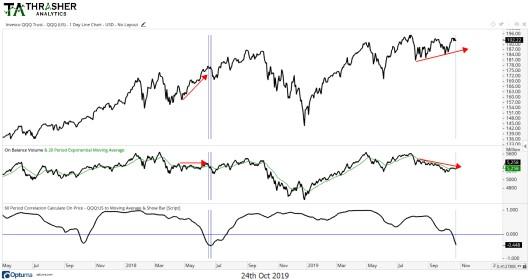
The last time correlation broke down like this was in 2018, when volume flat-lined coming out of the early 2018 decline in price. QQQ was able to continue higher for several more months ahead of its Q4 decline.
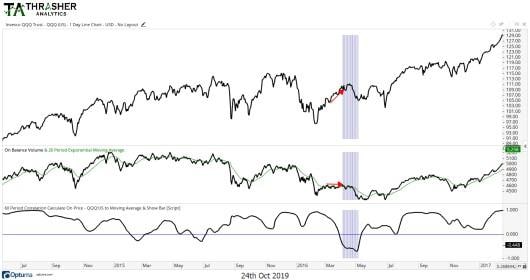
Next, we have the 2016 chart. QQQ began to improve after its prior decline but volume didn’t show signs of confirmation and price soon followed the OBV decline by moving lower for a few weeks before starting a strong two-year trend higher.
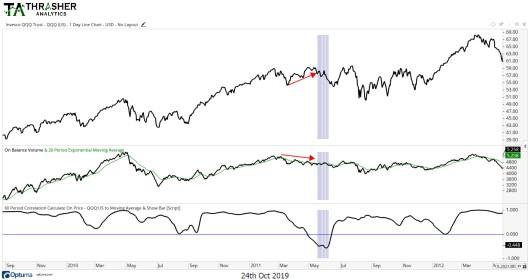
2011 also saw a bearish divergence in net-volume just ahead of its decline in price. The lack of buyer support gave an early warning that something was amiss in the price action for the Nasdaq 100 ETF.
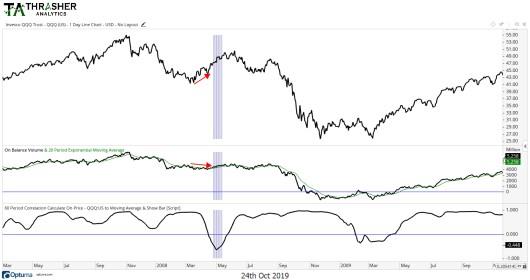
Finally, we have 2008. QQQ recovered after its first move lower but volume showed a negative correlation with fewer shares traded on up days versus down. The price soon followed the weakness in OBV as it moved lower during the financial crisis.
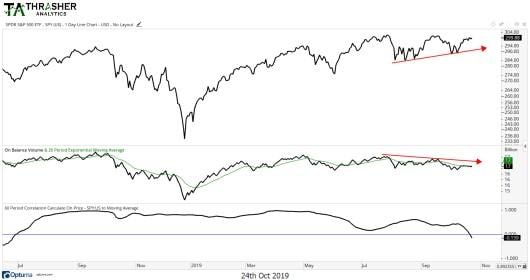
Is this bearish development in volume isolated to just the QQQ? Unfortunately not. The S&P 500 ETF also has a negative correlation between price and net-volume. While the 60-day correlation isn’t as negative for S&P 500 ETF as it is for the QQQ, it has recently moved negative.
How important is this divergence? I do give credence to volume, but in my view it is less useful than other tools we have available, such as momentum and breadth. If we start to see confirmation of this bearish development in volume by other indicators and ultimately in price, then we may see a reversal in trend.
However, like we saw in 2018 price can continue higher in the face of a volume divergence and there’s no reason we couldn’t see the same today. I’ll be keeping a close eye on volume going forward, while also tracking other more critical (in my opinion) market gauges for signs of internal market shifts.
Disclaimer: Do not construe anything written in this post or this blog in its entirety as a recommendation, research, or an offer to buy or sell any securities. Everything in this post is meant for educational and entertainment purposes only. I or my affiliates may hold positions in securities mentioned in the blog.
Please see my Disclosure page for full disclaimer.
Connect with Andrew on Google, Twitter and StockTwits.
Continue reading for FREE
- Includes free newsletter updates, unsubscribe anytime. Privacy policy


