Charting features
扫描二维码下载应用程序

点差¹
最高零售杠杆率
微型手数交易
金融工具
客户服务
交易标准手数的百分之
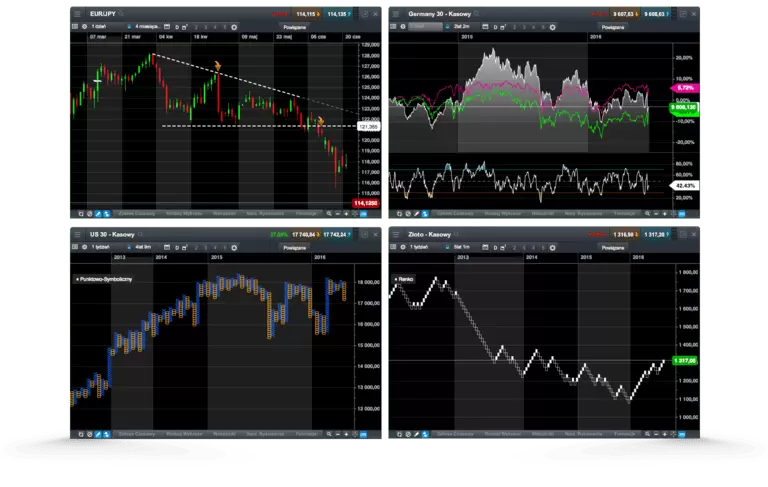
Technical analysis
Our fully-integrated technical analysis suite has been developed in-house and incorporated into our charting package, to deliver all the tools you need to analyse the financial markets.

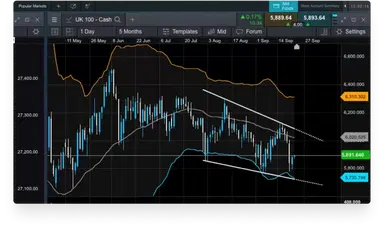
All our charts include a range of drawing tools that can be used to draw support and resistance levels, make notes on charts, and highlight key price moves and patterns.
Analyse price performance over the short- and long-term, with our charts for our major instruments covering up to 20 years' price history.
You can quickly switch between chart intervals, which range from one second through to one month.
Our layouts, charts and technical indicators are all customisable, offering you the ability to set up charts and technical analysis to suit your own style.
Identify correlated instruments by dragging and dropping one or more instrument on to another open chart to compare their price action and performance over the same timeframe.
Once you've customised a chart, save the setup as default, so that each time you load a new chart the same preferences are applied to it. You can save up to five charts per instrument.
Open trades directly from charts as opportunities emerge – just select a live streaming price to open an order ticket and place a trade. You can also modify or close any pending orders.
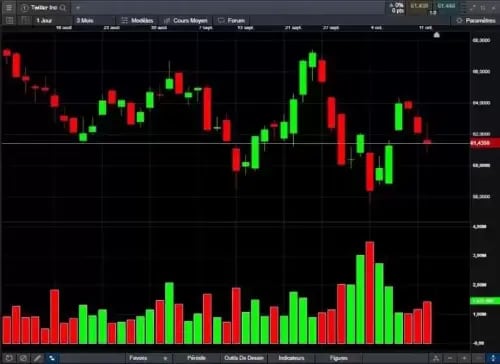
Volume on charting
Identify price momentum and confirm the existence or continuation of a trend by examining the volume-traded levels in parallel with price movements in real time. You can also look back at historical volume levels to identify historical trends and patterns. View our FAQs at the bottom of the page for more details.
Price projection
Available on every chart when logged in to your live account, our pattern recognition tool allows you to search for common technical chart and candle patterns, providing a price projection.
Pattern recognition
Let our pattern recognition tool scan for common technical patterns, such as head and shoulders, triangles and wedges, on any open chart across various time intervals, and view the price projection target area on the chart.
获奖的差价合约经纪商
ForexBrokers.com 奖项
专业交易员奖项
ADVFN国际金融奖
优秀理财指南奖
Module linking
This feature allows you to group charts together, so that when you change the instrument shown in one chart, all of the other charts in the group will automatically update to show the new instrument. This lets you examine the price action for the same instrument over multiple intervals and timeframes at the same time, so you can compare long-term analysis with short. Drawing tools, technical indicators, chart types, patterns and presets are all automatically applied to all charts in the group.
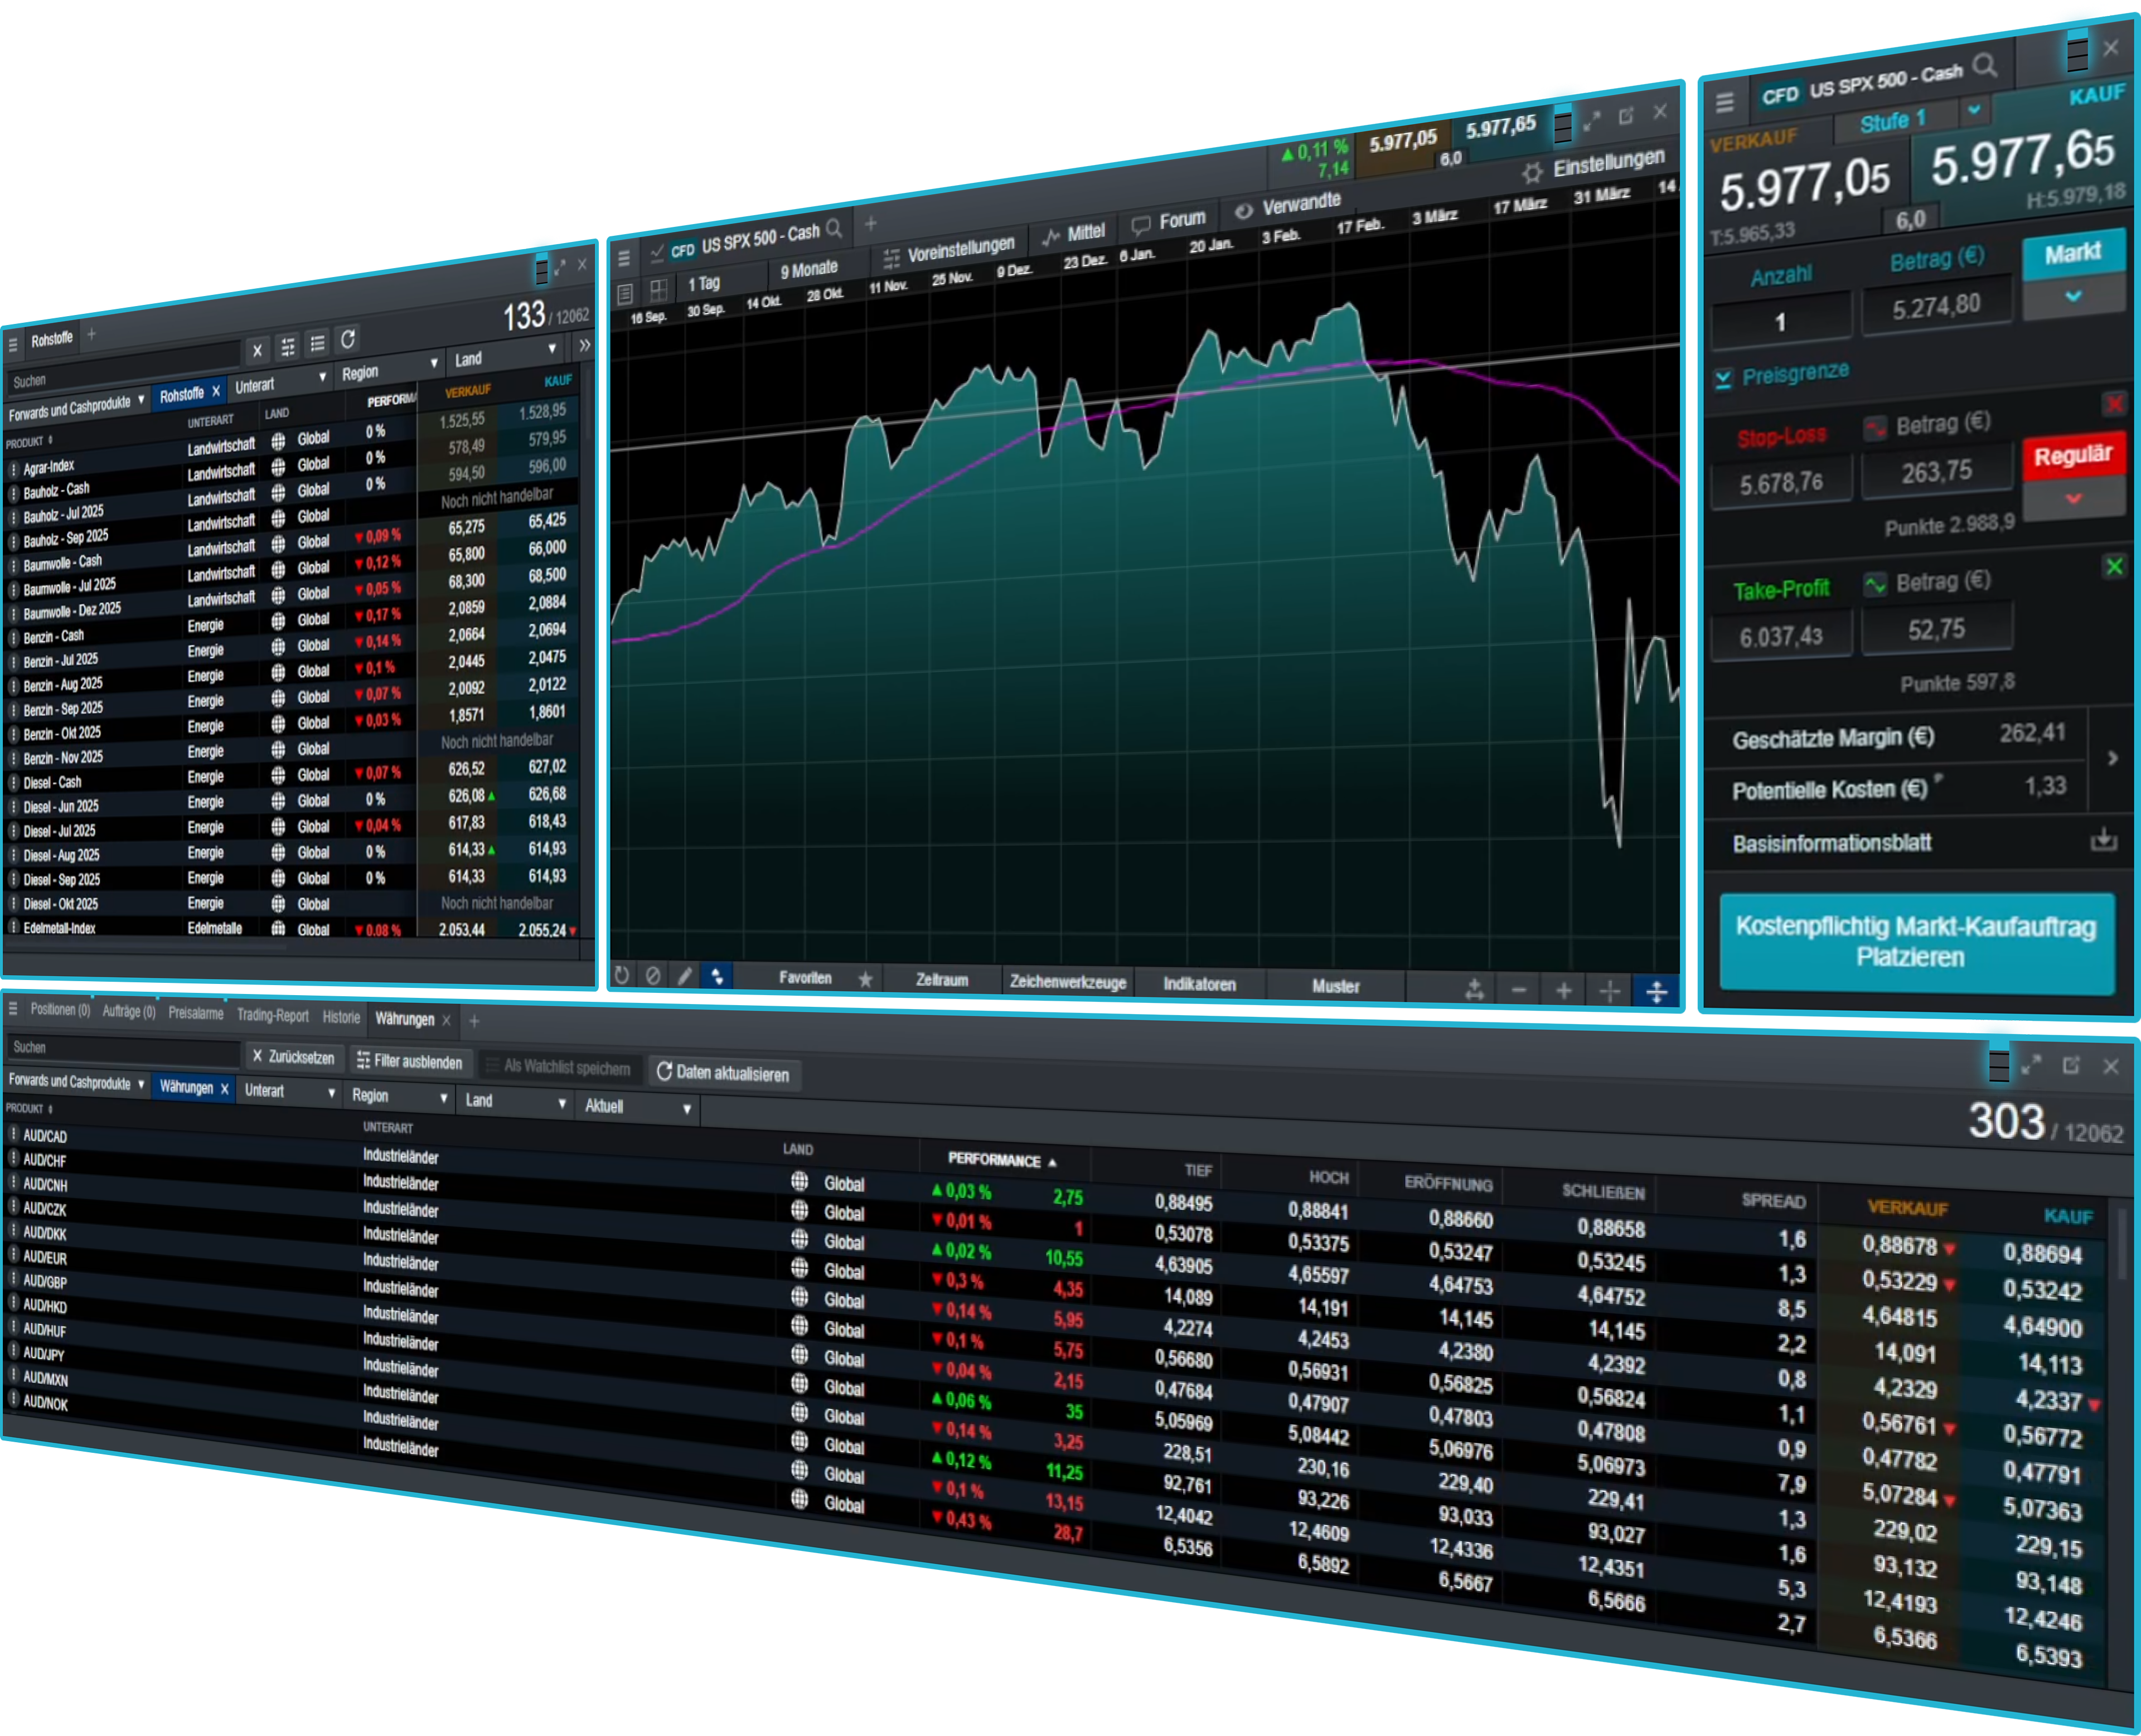
Chart forum community
The chart forum² lets you discuss and share chart analysis, trade set-ups and commentary from our analysts and other CMC Markets traders from within the charts.
Our global market analysts post insightful technical analysis and comments on popular instruments.
Instantly copy technical analysis from our analysts and other traders directly to your live charts for further research.
Comment on other traders' posts and use the directional arrows to indicate whether you think the market is going to go up or down.
Use the chart forum to take a snapshot of your analysis, so you can look back at your historical posts to see if your trading ideas went as expected.
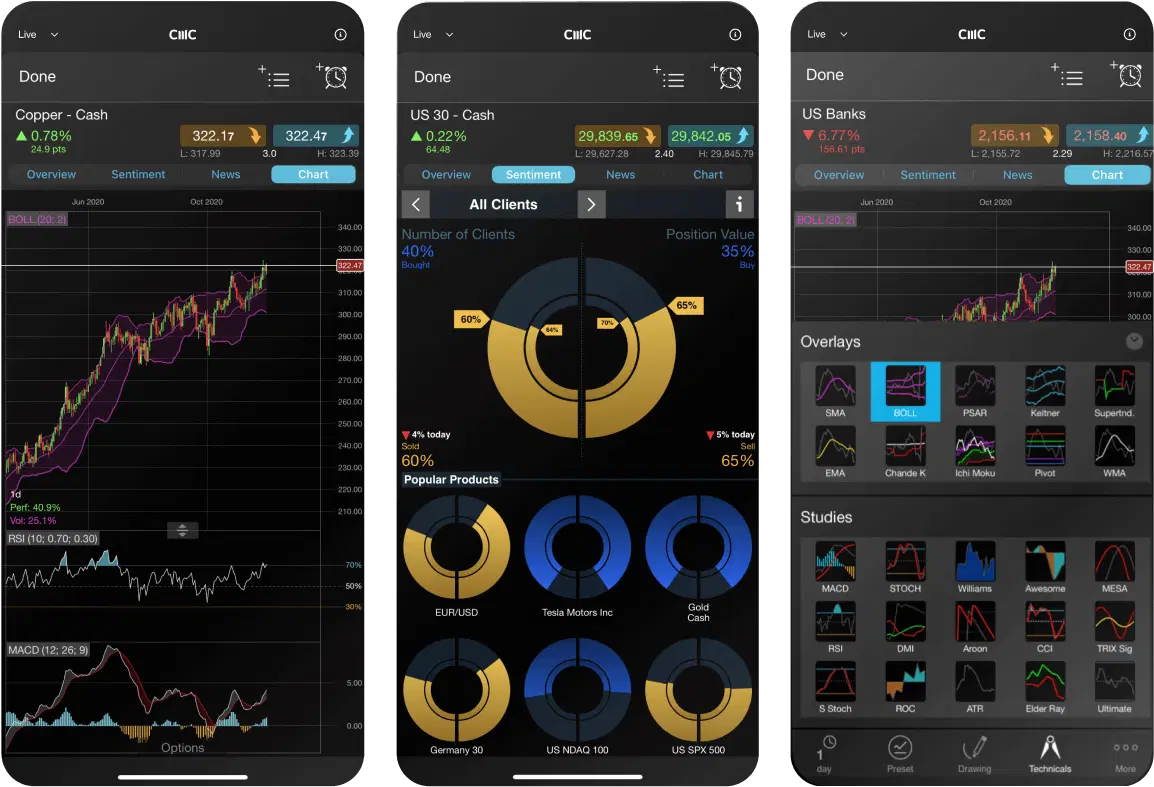
Mobile charting
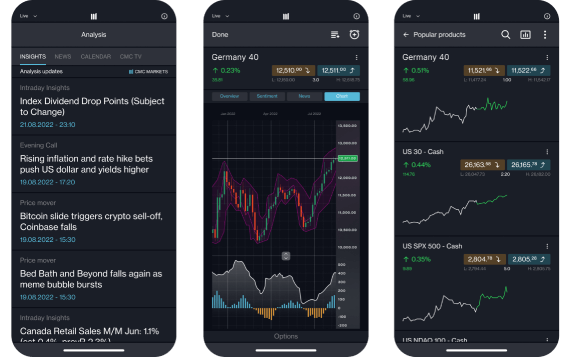
Our award-winning mobile app ³ includes five different chart types: line, bar, spread, heiken-ashi and candlestick charts.
The multi-chart view takes advantage of the larger screen size, allowing you to scan up to four charts at a time. Compare price action and identify significant market movements across multiple instruments.
Just tap any live streaming price to open an order ticket and place a trade, then edit open orders directly from charts.
Any analysis conducted on a chart opened through a watchlist is automatically saved when you close that chart, so you can easily access the analysis later.
常见问题
The most common charts for traders include line charts, bar charts and candlestick charts. A line chart is a very basic chart that is useful for showing simple trend movements. On the contrary, bar charts and candlestick charts display complex data that defines the opening price, closing price, highest price and lowest price in a specified period.
A technical indicator is a mathematical calculation used as part of technical analysis. Technical indicators analyse an asset's price history and volume statistics, to help traders predict future price movements.
Volume can help you identify the momentum of an instrument. The price movement and volume are often closely related – when the price increases, volume is likely to increase as well. Traders often watch price and volume movement in parallel to confirm the existence, or continuation of a trend.
Volume can also be used to identify when trading activity is declining, indicating when a trader might consider taking profit on their open positions.
Note that volume chart data refers to the trade volumes of the underlying asset, rather than CMC Markets' trade volumes.
Disclaimer: Volume chart information refers to the past. Any information relating to past performance of an investment is not a reliable indicator of future results. Volume charts are provided by CMC Markets for general information purposes. They are not intended to provide trading or investment advice and must not form the basis of your trading or investment decisions. CMC Markets will not be responsible for any loss incurred arising from any investments made based on volume charts.
We offer live volume data directly from the exchanges. However, in quiet periods for illiquid instruments, there might be limited or no volume updates for a short time.
The volume bar will be green if the underlying price is unchanged.
We collect volume data during the underlying exchange opening hours only (UK time):
UK and EU: 8am - 4.30pm
US: 2.30pm - 9pm
Currently, volume on charting is available when trading on indices and shares.
CMC Markets在全球设有15个办事处,分布在英国、澳大利亚、德国、加拿大、新西兰、新加坡和百慕大等地。CMC Markets的各个实体均获得当地监管机构的许可和监管,例如,CMC Markets百慕大获得百慕大金融管理局('BMA')颁发的投资业务和数字资产业务许可。
作为CMC Markets的客户,您的资金与CMC Markets自有资金分开持有。它被存放在分布于多家主要银行的隔离客户银行账户中,这些银行定期根据我们的风险标准进行评估。根据BMA规则,必须为零售客户提供负余额保护。这意味着您可能损失的最大金额就是您最初存入我们处的资金。
如果您使用MT4或MT5进行交易,选择您想交易的工具(在电脑或笔记本上双击),将会出现一个新的订单窗口。输入您想要的交易量(以手为单位),添加任何风险管理订单,如止损或止盈订单。然后按照您希望交易的方向下市价单;买入做多,或卖出做空。使用MT4或MT5有几种方式可以下单或下订单 - 您可以通过导航到"帮助 > 帮助主题"或"帮助 > 视频指南"了解更多关于MT4或MT5功能的信息。
如果您使用我们的Next Generation平台进行交易,从"产品库"中搜索您想要的工具。选择您选定的工具(在电脑或笔记本上右击),然后选择"订单窗口"。在订单窗口中,选择您的订单类型(市价单、限价单和止损入场单),然后输入您想要的交易量(以单位或金额为单位,可以从主导航栏的"设置"菜单中配置)。添加止损和止盈水平以最小化您的风险,并根据您是想做多还是做空选择"买入"或"卖出"。准备好后,选择"下买入市价单"或"下卖出市价单"。
对于零售客户,您目前可以使用的最高杠杆率为200:1(或0.5%保证金),适用于我们的差价合约交易和FX Active账户。
TradingView是一个交易研究平台,您可以在此查看图表、分析趋势并与在线社区互动。您可以将TradingView账户连接到CMC Markets账户,从而能够在TradingView内开立、管理和关闭交易。了解更多关于TradingView的信息点击这里。
MetaQuotes 公司的 MetaTrader 4 和 MetaTrader 5 是全球最受欢迎的外汇和差价合约交易平台。Next Generation 是 CMC Markets 自主开发的功能丰富的网页版交易平台。两种平台都提供差价合约(仅含点差)和 FX Active*(降低点差,基于佣金)账户。
Next Generation 平台无需下载,而 MT4 和 MT5 需要下载才能充分利用其功能,如通过专家顾问进行算法交易以及通过 MQL4 和 MQL5 社区进行社交交易。
MetaTrader 平台默认提供对冲头寸功能,而 Next Generation 平台默认提供净头寸功能。
*开仓和平仓时每笔交易的佣金为 0.0025%。
是的,使用智能交易系统的交易者可以开立相反、相关或替代交易,不会受到任何中断。
登录您的MT4或MT5客户端门户或Next Generation平台,并按照资金部分的说明进行操作。
您可以在登录页面选择"忘记密码?"来重置密码。我们随后会向您用于登录账户的电子邮件地址发送更改密码的说明。
我们的目标是始终为所有客户提供高水平的服务。我们重视所有反馈,并利用它来改进我们的产品和服务。我们理解有时可能会出现问题或误解。我们致力于以积极和同理心的态度处理询问和投诉。当我们有过错时,我们旨在尽早纠正。您可以在这里找到我们的投诉处理程序,或通过以下邮箱联系我们开始您的账户查询:global@cmcmarkets.com请注意,所有查询和投诉将以英语处理。
1The chart forum is not intended to issue financial promotions, provide investment advice or encourage users to engage in investment activity. Any content posted by us will not have taken your circumstances into account. We are not liable for any course of action you may take or refrain from taking, or any loss or damage suffered by you, as a result of relying on any information provided on the chart forum.