Technical analysis
Traders use technical analysis to identify patterns in financial markets and determine potential future price trajectories. Ultimately, traders want their trades to be profitable. While technical analysis cannot ensure success, it can help traders make informed trading decisions by giving them deeper insights into the market.
So, whether you’re new to trading or looking to refine your strategy, read on to discover how technical analysis can provide a structured approach to trading.
What is technical analysis?
Technical analysis involves evaluating past price movements and market data in an attempt to forecast future price movements.
Traders study historical market data – including prices and trading volume – in the belief that an understanding of previous market trends and patterns will enable them to make informed predictions about the possible direction of prices in the future.
Why use technical analysis?
Technical analysis is based on the theory that markets move in repeatable, quantifiable patterns. Unexpected price moves sometimes confound this idea. Nevertheless, technical analysts evaluate price trends and patterns in a bid to identify potential trading opportunities. They believe that past price movements can be a useful indicator of what might happen to prices in the future.
Although forecasts based on historical data can turn out to be inaccurate, technical analysts might argue that, at the very least, technical analysis can be a useful way to gauge a market’s strength or weakness.
The potential benefits of technical analysis include:
Technical analysis tools
Technical analysis is typically carried out using charts, technical indicators and drawing tools. Charts tend to be based on historical market data, including opening and closing prices, intraday highs and lows, trading volumes, time, and sentiment.
Learning how to use these tools could help you analyze market behaviour and develop a more rigorous approach to trading. Some commonly used charts and indicators are outlined below.
Technical analysis charts
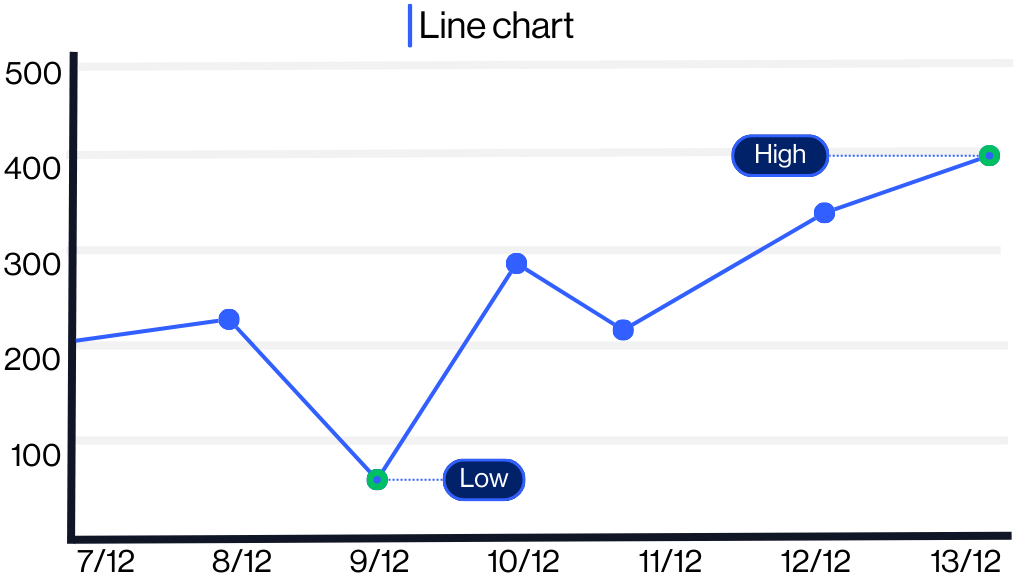
Line charts
Line charts provide a simple visual representation of price movements over time. They can be used at a high level to spot trends, compare timeframes, and identify potential entry and exit points.
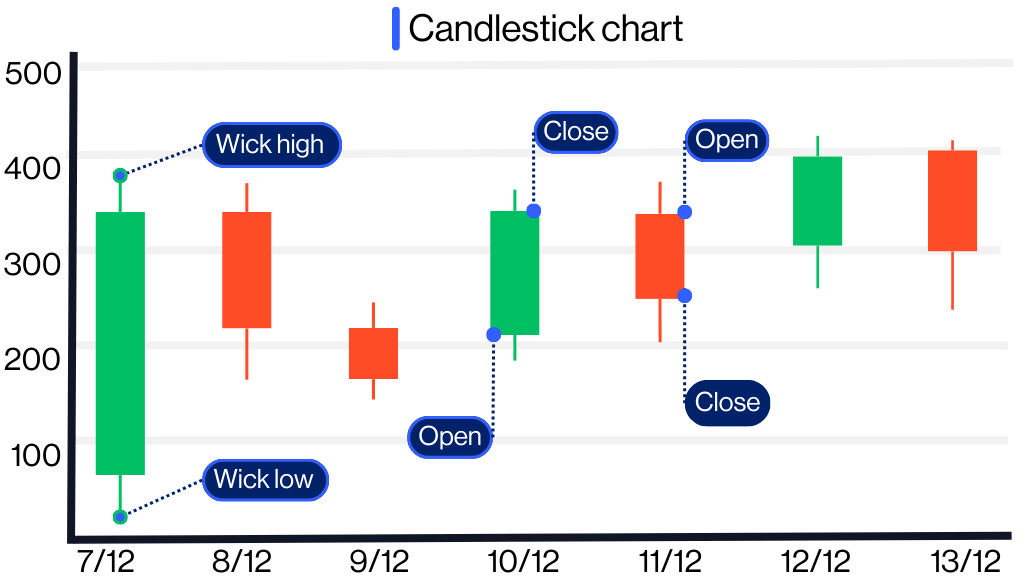
Candlestick charts
So named because the bars resemble candlesticks, these charts display more information than a straightforward line chart. The ‘wick’ shows the high and low price while the thicker part of the candle shows the open and closing price for each time period. This type of chart is ideal for spotting short-term price moves, shifts in market sentiment, and potential reversals.
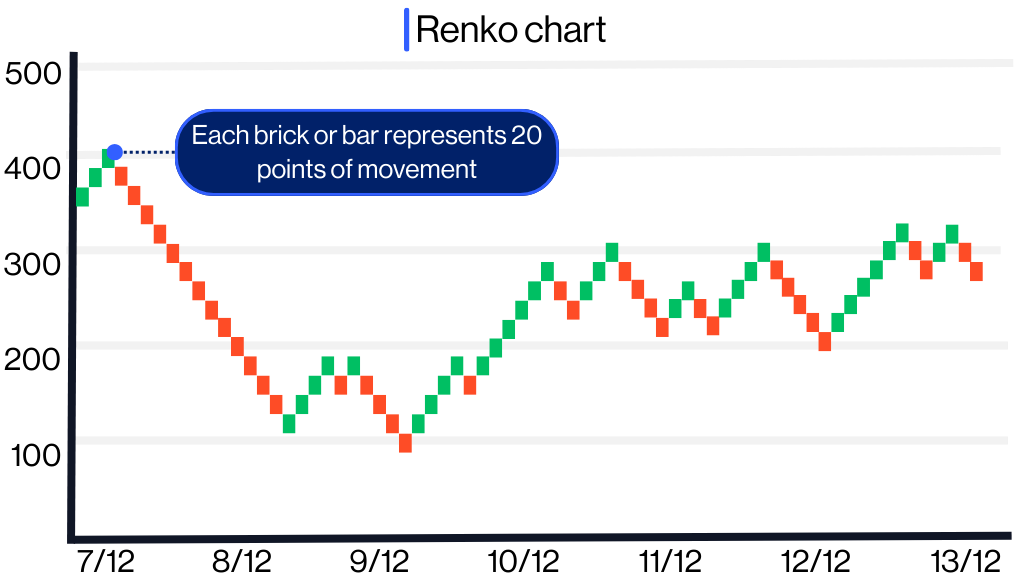
Renko charts
Renko charts focus on price movement, ignoring time. They’re useful for filtering out market noise and painting a clear picture of significant trends and price reversals.
Technical analysis indicators
Trends
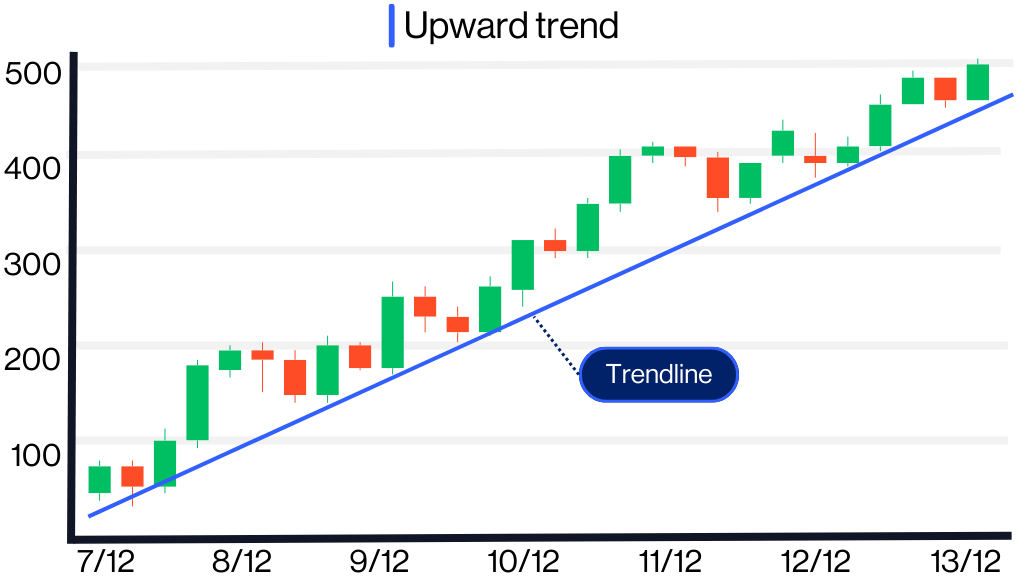
Trendlines show the general direction of a market over time. By recognizing whether a market is trending upwards, downwards, or sideways, you can align your strategy with that direction.
Patterns
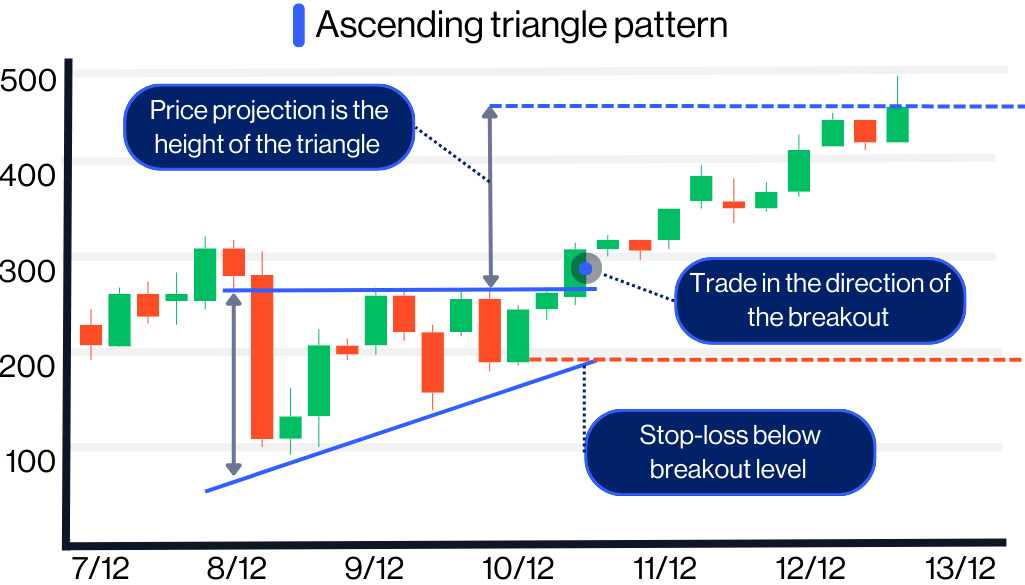
There are various chart formations that signal potential future price movements. Common patterns include head and shoulders, ascending and descending triangles, and flags, which can be used to anticipate market direction.
Support and resistance
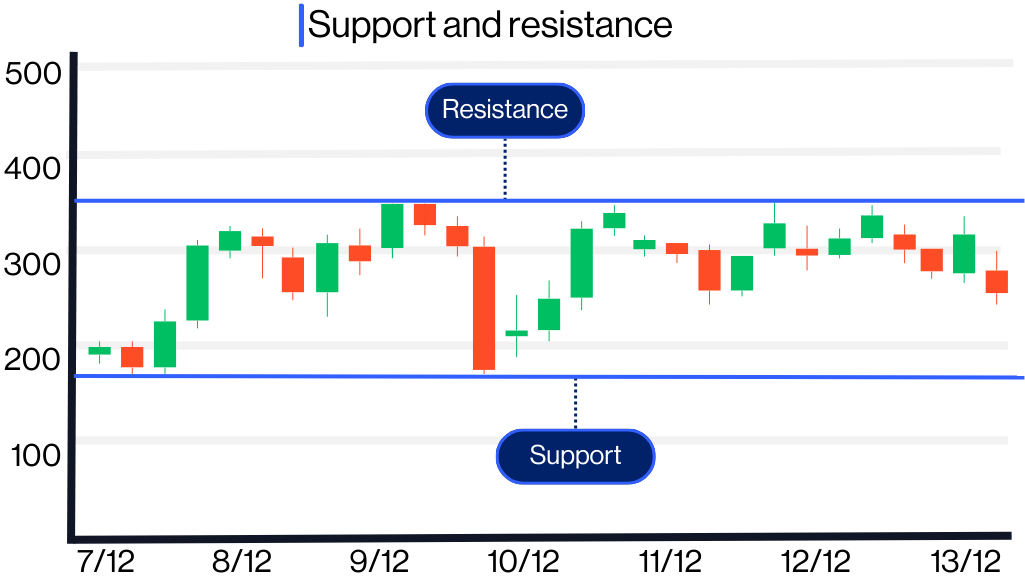
Support levels are areas where prices may stop falling, and resistance levels are areas where prices may stop rising, based on historical data. Identifying these levels can help you decide at which point to enter or exit a trade.
Correlation
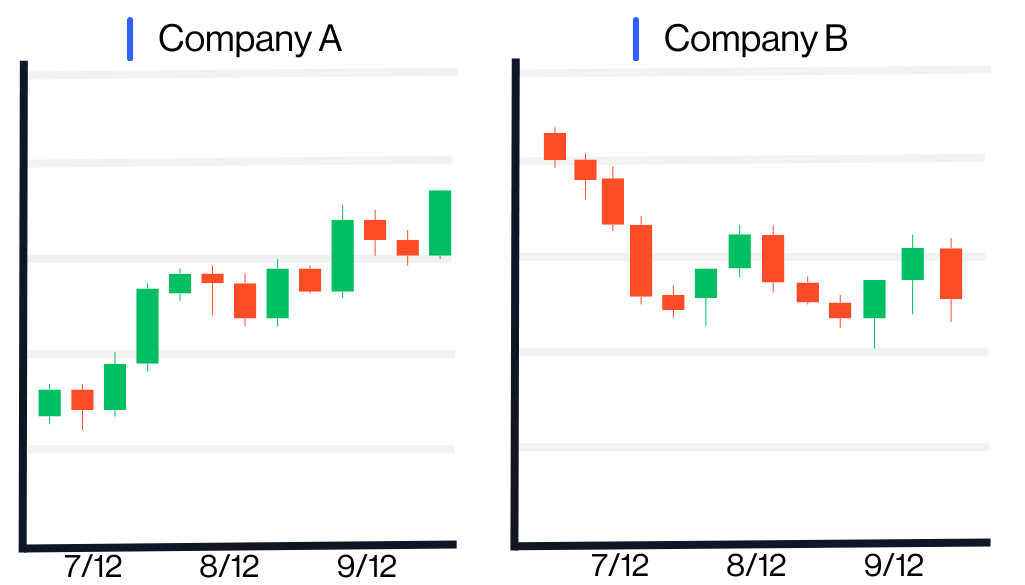
Correlation is a measure of how two or more markets or assets move in relation to each other. By understanding market correlations, you may be able to diversify your portfolio or hedge your trades more effectively.
Moving average
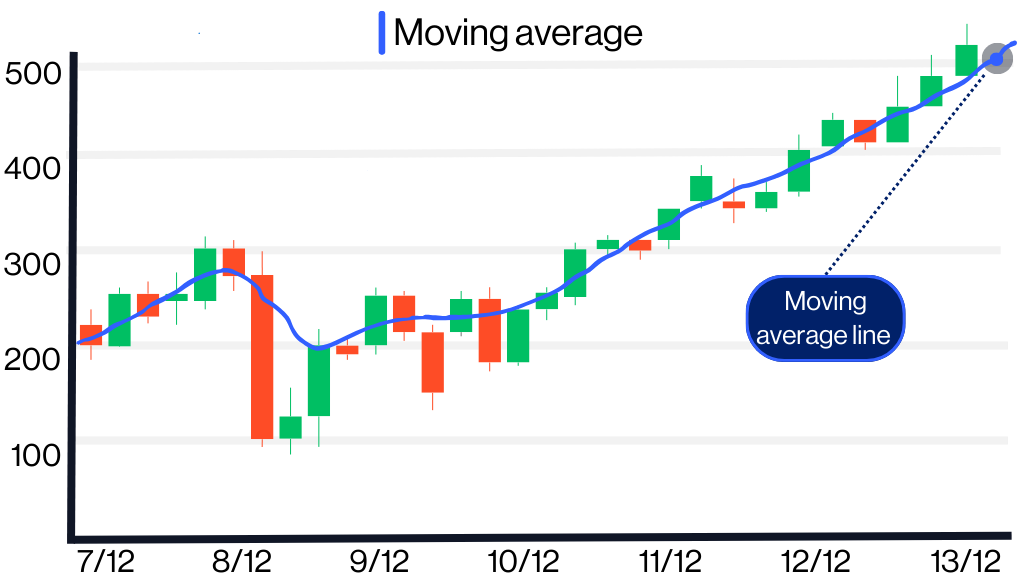
A moving average smooths out price data by creating a constantly updated average price. This makes spotting trends easier, as it removes day-to-day price fluctuations.
Fibonacci retracements
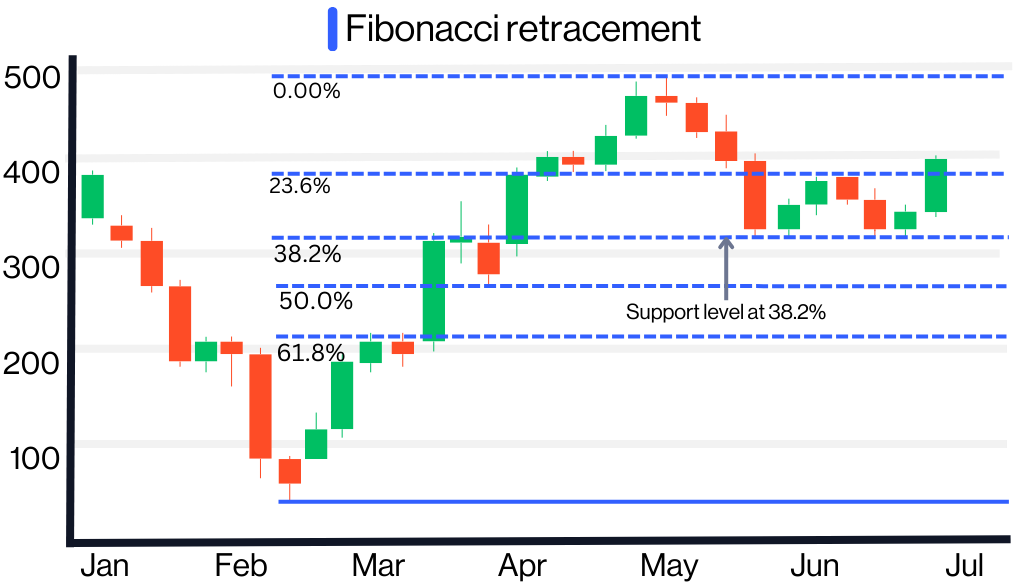
Fibonacci retracement levels are price levels, often represented as dotted lines on a chart, that show where possible support and resistance zones may occur. The levels are based on the Fibonacci sequence, with commonly used levels including 23.6%, 38.2% and 61.8%.
Finding the right technical analysis tools
As with most aspects of trading, technical analysis is subjective. Finding what works for you will depend on various factors, including your trading style, objectives and the markets you focus on. But by learning about technical analysis and the key features of different charts and indicators, you may find tools that suit your approach. You can then hone your technical analysis skills over time to support your trading decisions.
If you’re just starting out with technical analysis, here are a few helpful pointers:
Start with the basics
Get to know the key indicators, like moving averages and support/resistance levels. They provide a solid foundation and should help illustrate market trends without overwhelming you with complex data.
Experiment
As you gain experience, explore more advanced indicators such as RSI (relative strength index) and MACD (moving average convergence/divergence), which offer insights into market momentum and trend strength.
Use tools that fit your style
Different charts and indicators suit different trading styles. If you prefer short-term trading, candlestick or Renko charts may help you spot sudden price movements. For longer-term traders, triangle patterns or moving averages can provide a broader view of market trends.
Customize your approach
Once you’ve tested a few technical analysis tools, try to customize your approach. For example, combining multiple indicators can offer a more comprehensive view of past market behaviour, helping you identify stronger signals and manage risk.
Technical analysis can involve utilizing different chart types, patterns and timeframes, as well as trading indicators, whether these are manual or automatic.
Discover the powerful features and tools available in our award-winning trading platform and app¹.
Choosing which form of analysis to use, or whether to use a combination of the two approaches, depends on a range of factors, including the specific market or instrument that you’re trading, and the chart type and timeframe you’re using.
Traders who are looking at a very short-term timeframe, for example, may prefer a more technical, precise and analytical approach. On the other hand, certain markets may influenced more by external economic factors and longer-term trends, and so a fundamental analysis approach could be more suitable.