It will be a holiday-shortened trading week in the US, with markets closed on Friday 3 July, in observance of Independence Day. However, the week still features several key economic releases, including the US jobs report, UK GDP figures and Eurozone inflation data. Finally, on the earnings front, Nike will be the highlight of the week. A fresh earnings season is due to begin in mid-July.
- Market News
- Weekly outlook
- The Week Ahead: Nike earnings, ISM manufacturing, US jobs report
The Week Ahead: Nike earnings, ISM manufacturing, US jobs report
CMC Markets

Table of contents
- 1.Nike Q4 earnings
- 2.ISM June manufacturing PMI
- 3.US June jobs report
- 4.Economic and company events calendar
Nike Q4 earnings
Tuesday 30 June
Analysts expect the New York Stock Exchange-listed athletic apparel manufacturer to report fiscal fourth-quarter 2026 earnings of $0.13 a share, a decline of 6% year-on-year. They also forecast revenue to fall 2% to $10.8bn, with gross margins contracting to 40%, down from 42% in the the previous quarter. The company is set to provide first-quarter fiscal 2027 guidance, with analysts expecting earnings to decline 6.8% to $0.46 a share and revenue to fall 1.7% to $11.5bn. However, they forecast gross profit margins to expand to 41.9%. The options market implies that Nike's share price – down roughly 35% this year at $40.90, as of Thursday's close – could move 7.9% in either direction after the results are released.
Nike shares have fallen sharply over the past year, and, unsurprisingly, options positioning is bearish. From an options gamma perspective, $40 is the key level of options support, while $50 is the primary resistance level.
Options markets are pricing implied volatility at around 80% for options expiring this week and it is likely to continue to climb as we approach the 30 June earnings report. Once the company reports results and implied volatility falls, hedging flows could become more positive. Despite the bearish options positioning, that could provide a bullish tailwind after earnings.
From a technical perspective, Nike is trading at its lowest level since September 2014 and has filled a gap near $40 that was formed in July 2017. If the stock breaks below the $40 support, the next likely downside support is around $35. However, if the shares bounce, resistance is around $52. A move to that level could fill the gap created in March 2026.
Nike share price, July 2014 – present

Sources: TradingView, Michael Kramer
ISM June manufacturing PMI
Wednesday 1 July
The ISM Manufacturing Purchasing Managers' Index (PMI) is expected to ease to 53.7 in June from 54.0 in May. While the headline figure is important, investors are likely to pay close attention to the prices paid index, which has recently surged above 80 and continues to signal persistent inflationary pressures in the US manufacturing sector. The employment index will also be closely watched as it provides a timely lead into the more comprehensive June US jobs report due the following trading session.
A stronger-than-expected ISM print (particularly on prices paid) would reinforce the view that the Federal Reserve may be falling behind the inflation curve. This typically supports further USD strength, weighing on the Australian dollar.
The AUD/USD has faced meaningful downside pressure recently amid broader USD gains. The pair is currently trading around the 0.6890 level, holding near recent lows.
Sources: TradingView
US June jobs report
Thursday 2 July
Economists expect the June jobs report to show payrolls increased by 135,000, down from 172,000 in May. They also expect the unemployment rate to remain unchanged at 4.3%, while average hourly earnings are forecast to rise by 3.5% year-on-year, up from 3.4%. This will be the headline report of the week and potentially the most important economic release ahead of the July Fed meeting.
A strong report would further strengthen the case for the Fed to focus less on the labour market and more on persistent price pressures as it continues efforts to bring inflation back to target. That could prove very negative for risk assets, particularly the S&P 500, which has struggled since peaking on 2 June. The index continues to trade below its 10-day exponential moving average, which has recently served as resistance.
If the S&P 500 were to break below 7,300, it could open the door to a move towards the 7,150–7,200 range. That would likely heighten concerns that the index has further to fall, especially if it becomes more apparent that the Fed may be forced to raise rates before the end of the year. A move above the 10-day EMA could propel the index back to 7,520.
S&P 500, October 2025 – present
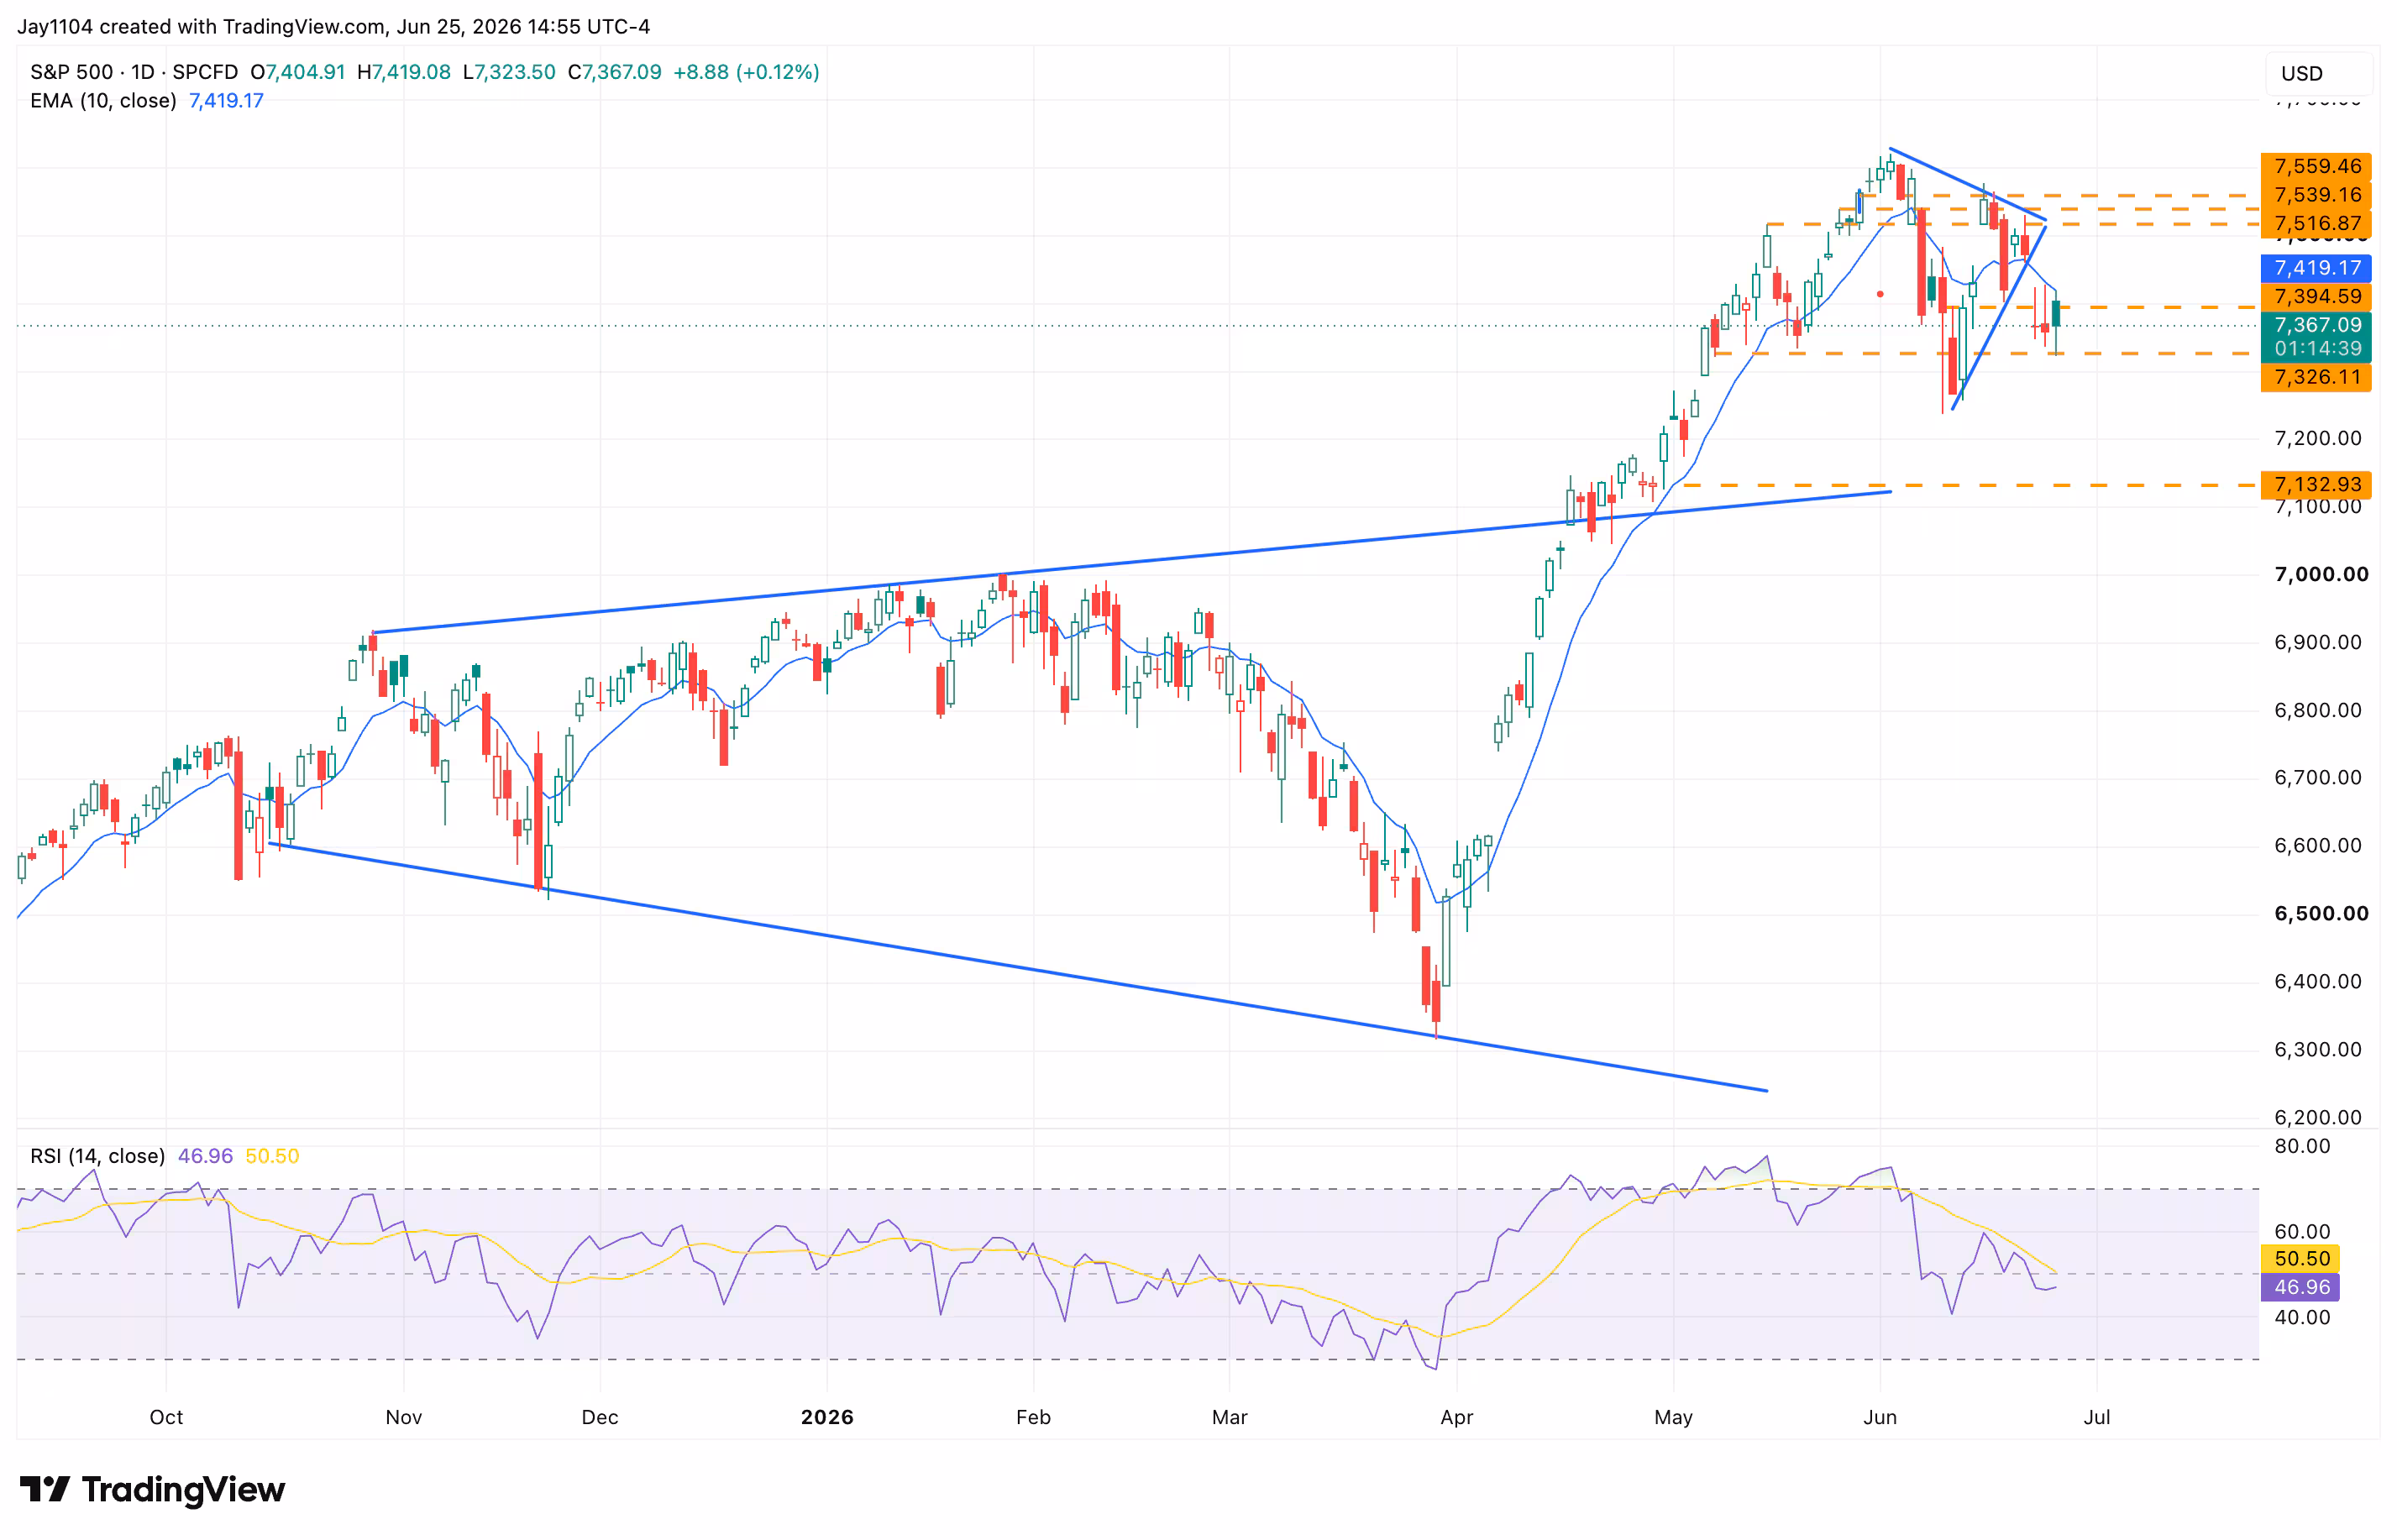
Sources: TradingView, Michael Kramer
Economic and company events calendar
Major scheduled data releases and company results include:
Monday 29 June
• Japan: May retail sale
• Eurozone: June consumer confidence
• Results: No major scheduled earnings announcements
Tuesday 30 June
• China: June manufacturing and non-manufacturing purchasing managers' indices (PMIs)
• Eurozone: June inflation data
• Japan: May unemployment rate
• UK: Q1 gross domestic product (GDP)
• US: May Job Openings and Labor Turnover Survey (JOLTS) job openings; June consumer confidence
• Results: Nike (Q4), Constellation (Q1), Sainsbury’s (Q1)
Wednesday 1 July
• Eurozone: June flash consumer price index (CPI)
• Japan: Q2 Tankan survey
• US: June ADP employment change; June Institute for Supply Management (ISM) manufacturing PMI
• Results: General Mills (Q4), Associated British Foods (Q3)
Thursday 2 July
• Eurozone: May unemployment rate
• US: June non-farm payrolls, unemployment rate and average hourly earnings; initial jobless claims
• Results: Lindsay (Q3), Currys (FY)
Friday 3 July
• Eurozone: Composite PMI
• Results: No major scheduled earnings announcements
Note: Announcements and dates are subject to change. Cross-check times in your timezone using the platform market calendar.
Disclaimer: This article provides general information only. It has been prepared without taking account of your objectives, financial situation or needs. It is not to be construed as a solicitation or an offer to buy or sell any financial instruments, or as a recommendation and/or investment advice. It does not intend to support an investment decision and it should not be relied upon by you in evaluating the merits of investing in any financial instruments. You should consider your objectives, financial situation and needs before acting on the information in this article. CMC Markets believes that the information in this article is correct, and any opinions and conclusions are reasonably held or made on information available at the time of its compilation, but no representation or warranty is made as to the accuracy, reliability or completeness of any statements made in this article. CMC Markets is under no obligation to, and does not, update or keep current the information contained in this article. Neither CMC Markets nor any of its affiliates or subsidiaries accepts liability for loss or damage arising out of the use of all or any part of this article. Any opinions or conclusions set forth in this article are subject to change without notice and may differ or be contrary to the opinions or conclusions expressed by any other members of CMC Markets.

