It will be a holiday-shortened trading week in the US as markets close for Martin Luther King Day on Monday. The week will also be light on data from the world’s largest economy, with the standout release being the government shutdown-delayed November personal consumption expenditures (PCE) price index report – the Federal Reserve’s preferred inflation gauge. Inflation will be also be in the news in Britain, where the consumer price index (CPI) print for December is due out on Wednesday. In Asia, the focus will be on interest rate decisions from central banks in China (on Tuesday) and Japan (Friday), which could have implications for forex markets. Meanwhile, earnings season continues to ramp up, with Netflix among the big names set to report quarterly results.
- Market News
- Weekly outlook
- The Week Ahead: Netflix earnings; UK, US inflation; BoJ rate decision
The Week Ahead: Netflix earnings; UK, US inflation; BoJ rate decision

- 1.Netflix Q4 earnings
- 2.UK, US inflation
- 3.Bank of Japan interest rate decision
- 4.Market Calendar - Economic Data
- 5.Market Calendar - Earnings
Netflix Q4 earnings
Tuesday 20 January
Analysts expect Netflix’s fourth-quarter earnings to come in at $0.55 a share, up 29.3% year-on-year, with revenue jumping an estimated 16.8% to $11.97bn. Looking ahead to Q1, analysts see earnings increasing 22.6% to $0.81 a share, with revenue rising 15.6% to $12.2bn. Options markets imply that traders expect shares of the Nasdaq-listed streaming service to move by an average of 6.9% in either direction after the Q4 earnings release.
Implied volatility for the stock is around 70% for options expiring in the trading week to 23 January. That level could continue to rise before the Q4 results are released on Tuesday afternoon in the US. While options positioning appears fairly neutral, it suggests a significant concentration of gamma around $95, with another notable level around $85. This is likely to keep the stock trading in a range between $85 and $95 following the upcoming earnings report, unless there is a major surprise in the results.
The technical chart below shows that the Netflix share price has been trending lower recently. However, the relative strength index (RSI), which dropped below 30 last month indicating oversold conditions, has edged up from its December low. This represents a bullish divergence, with the share price falling to lower lows while the technical indicator (the RSI) rises and posts higher lows. This can be a signal that market momentum is strengthening, suggesting that the share price may rise, although such a move is not guaranteed. In terms of the key levels to watch, there is strong support at around $83, while to the upside resistance awaits at $99.
Netflix share price, January 2025 - present
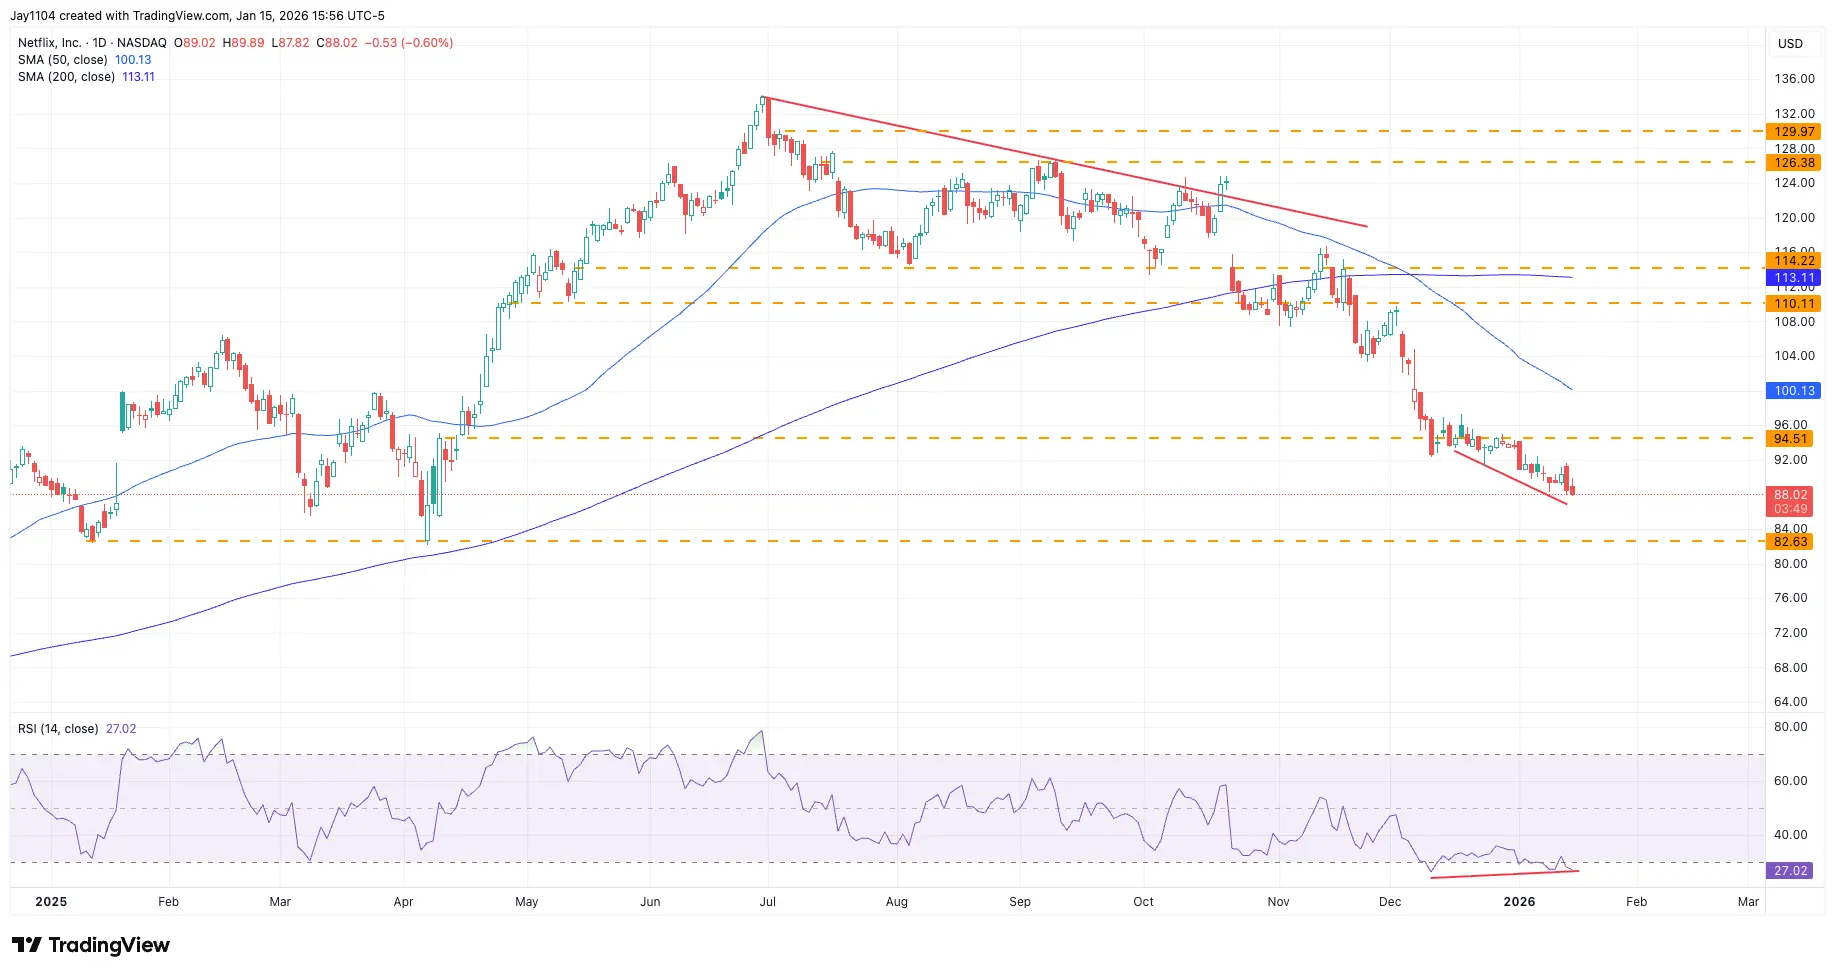
Sources: TradingView, Michael Kramer
UK, US inflation
Wednesday 21 January (UK December CPI)
Friday 23 January (US November PCE price index)
Inflation in the UK eased from 3.8% in September to 3.6% in October, then cooled further to 3.2% in November, supporting the Bank of England’s decision to cut interest rates to 3.75% in December. With economists estimating that inflation fell to 3.1% in December, there is scope for more rate cuts from the Bank of England in 2026. The market is currently pricing in two quarter-point cuts this year, which would bring the base rate down to 3.25% as policymakers look to stimulate economic growth.
In the US, meanwhile, inflation as measured by the PCE price index was hovering at 2.8% in September, the most recent month for which data is available. Economists estimate that the headline measure of PCE eased to 2.7% in November, while the core measure (which excludes volatile food and energy prices) stayed at 2.8%. In terms of rate-cut bets, the market expects the Fed to reduce the cost of borrowing by half a percentage point this year, although those calculations could change depending on the PCE data.
Against this backdrop of cooling inflation and lower rates on both sides of the Atlantic, the pound has weakened slightly against the dollar this month to around $1.3410. However, sterling has at least found support near its 200-day moving average at about $1.34. A drop below this level could set up a retest of $1.317. Conversely, if the US PCE report points to an easing of inflationary pressures and the market begins to price in additional Fed rate cuts, GBP/USD could rally back above $1.35 and potentially higher.
GBP/USD, March 2025 - present
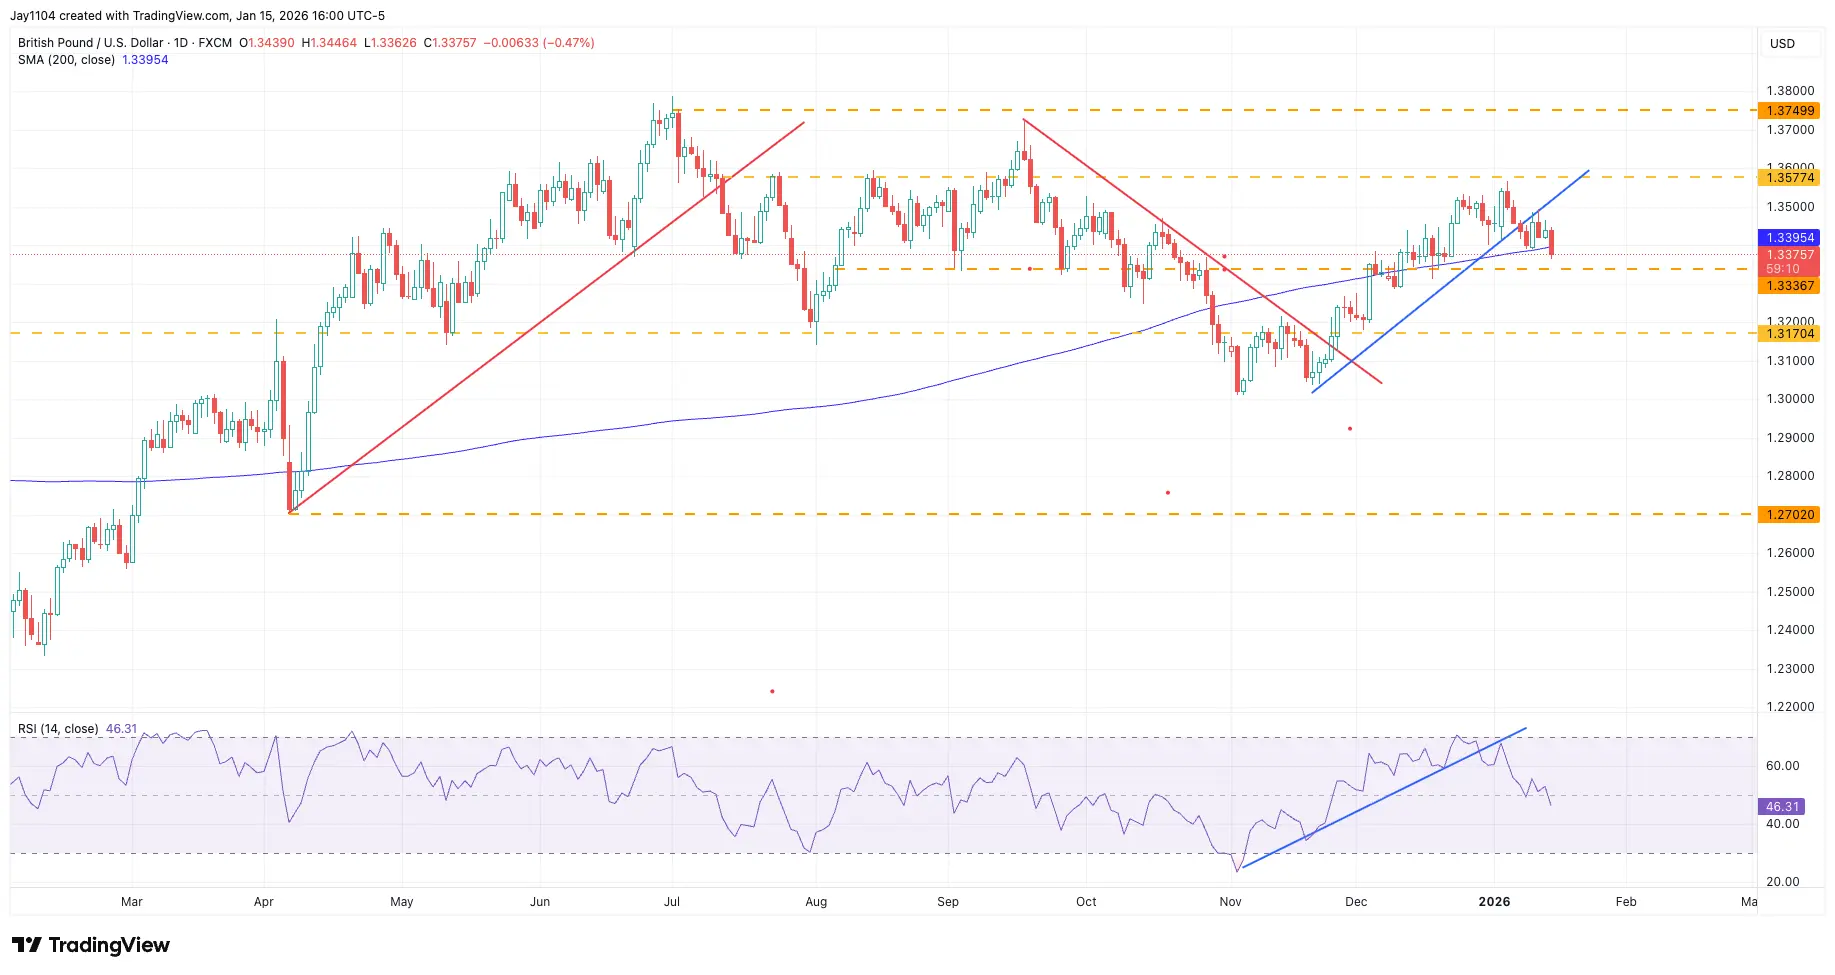
Sources: TradingView, Michael Kramer
Bank of Japan interest rate decision
Friday 23 January
The Bank of Japan is poised to leave interest rates unchanged on Friday, with the market not expecting any further rate hikes until June or July. That puts the focus on any hints that governor Kazuo Ueda may drop about how far the central bank intends to raise rates over time, and whether it plans to lift its economic growth forecasts. At its December meeting, the BoJ raised its main interest rate by a quarter of a percentage point to “around 0.75%”, the highest level in 30 years, as policymakers strive to tame inflation, running at 3% in November.
This month’s rate meeting comes at a sensitive moment for the Japanese yen, which has weakened against other major currencies, including the US dollar. The yen weakened past ¥159 per dollar on Wednesday, its highest level since July 2024, before recovering to around ¥158.20 by Friday. The ¥158.50 area remains an important resistance zone, as it marks the highs seen at the start of 2025. Beyond this zone, there is little in the way of technical resistance until around ¥162. If the BoJ fails to deliver a sufficiently hawkish message on interest rates, the yen remains at risk of further depreciation.
This vulnerability persists even though interest rates in Japan have risen over the past year, across both the front end and the long end of the yield curve. At this stage, the BoJ needs to signal to markets that more rate hikes lie ahead to prevent further yen weakness. Failing that, the only remaining option may be for the government to consider intervention in the currency market.
USD/JPY, December 2023 - present
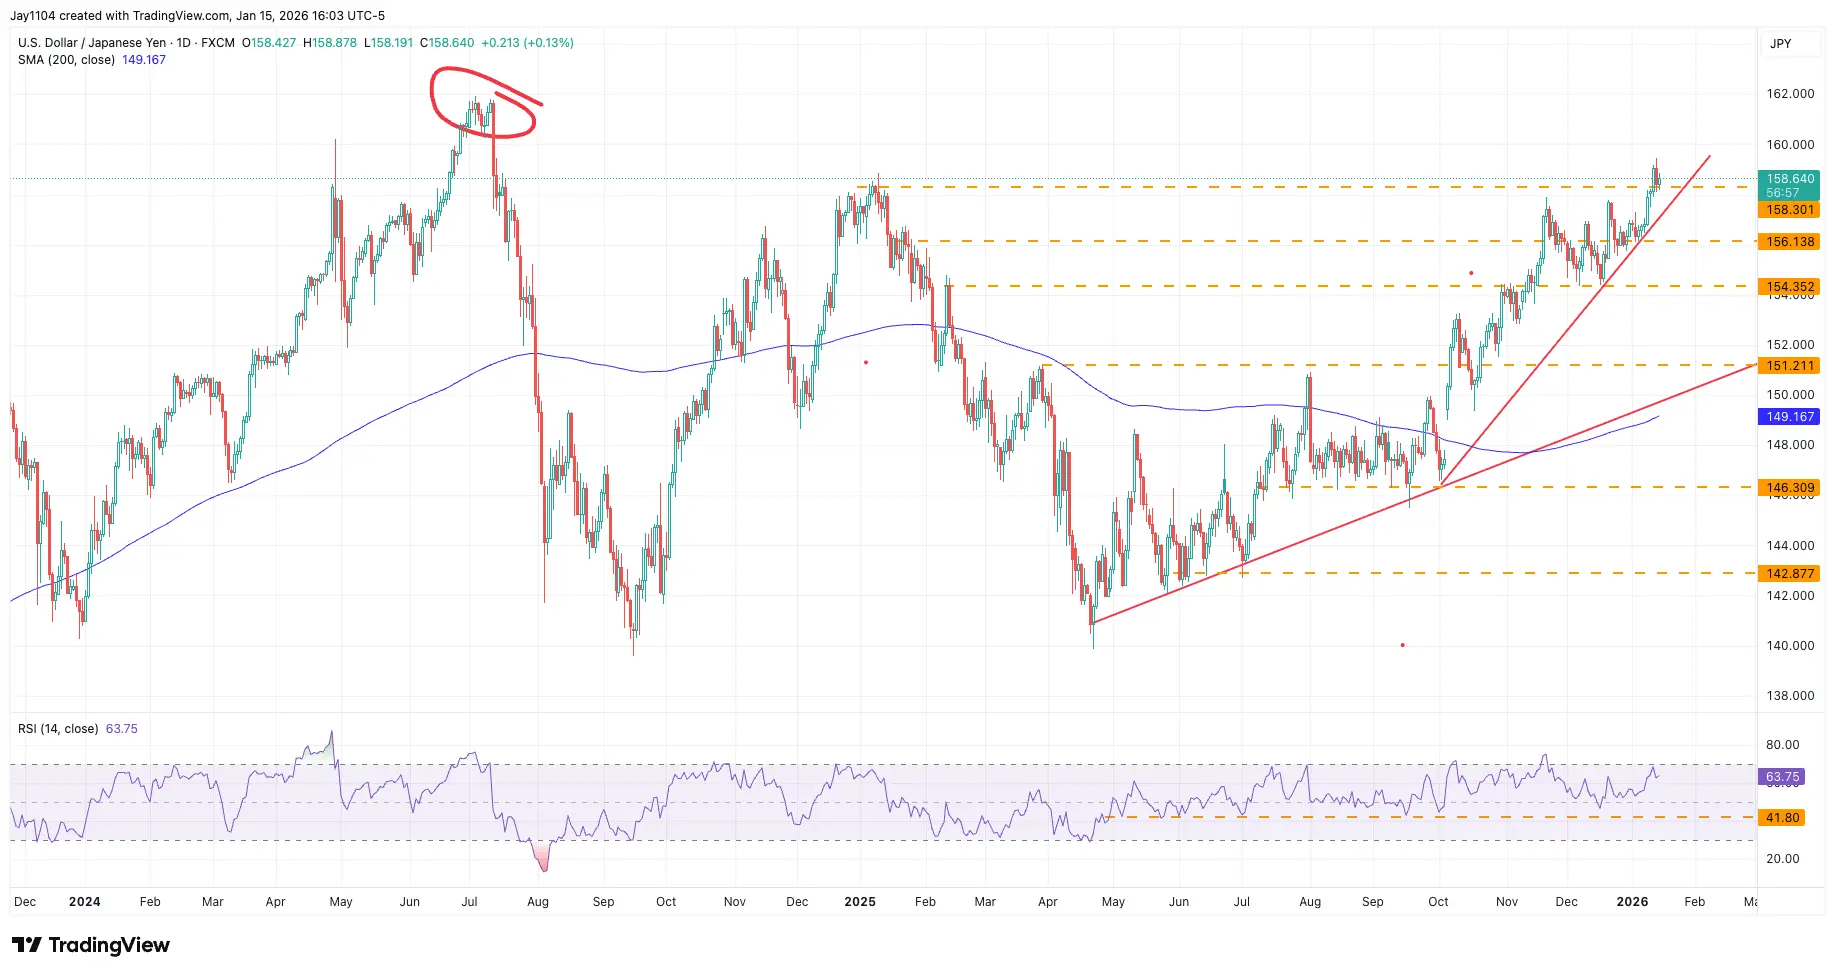
Sources: TradingView, Michael Kramer
Market Calendar - Economic Data
A preview of key economic events across the US, Australia and New Zealand this week. Log in to view the full market calendar, including event times, forecasts and alerts.
Thursday 22 January
Country | Event | Impact |
US | Construction spending – new construction | 🟠🟠 |
US | Housing index – pending home sales (MoM) | 🟠🟠 |
NZ | Electronic card retail transactions (MoM) | 🟠🟠 |
NZ | Electronic card retail transactions (YoY) | 🟠🟠 |
AU | Employment change | 🔴🔴🔴 |
AU | Participation rate | 🔴🔴🔴 |
AU | Unemployment rate | 🔴🔴🔴 |
Friday 23 January
Country | Event | Impact |
US | Continuing unemployment claims | 🟠🟠 |
US | Initial jobless claims (WoW) | 🔴🔴🔴 |
US | GDP – final | 🔴🔴🔴 |
US | GDP deflator – final | 🔴🔴🔴 |
US | PCE core price index (MoM) | 🔴🔴🔴 |
US | PCE core price index (YoY) | 🔴🔴🔴 |
US | Personal consumption (MoM) | 🟠🟠 |
US | Personal income (MoM) | 🟠🟠 |
US | EIA crude oil inventories | 🟠🟠 |
NZ | CPI (QoQ) | 🔴🔴🔴 |
NZ | CPI (YoY) | 🟠🟠 |
Market Calendar - Earnings
Date (US) | Company name | Timing |
|---|---|---|
Tuesday 20 January 2026 | Netflix | Post |
Wednesday 21 January 2026 | Johnson & Johnson | Pre |
Wednesday 21 January 2026 | Charles Schwab | Pre |
Thursday 22 January 2026 | Procter & Gamble | Pre |
Thursday 22 January 2026 | Intel | Post |
Earnings dates are shown in US market time. As results are often released pre or post market, the local calendar day may differ in Australia and New Zealand.
In general:
US pre market releases appear late evening in Australia and after midnight in New Zealand
US post market releases appear the following morning in both Australia and New Zealand
As a result, some earnings listed for a US date may be seen on the next calendar day locally. Please check specific local timings where relevant.
Disclaimer: This article provides general information only. It has been prepared without taking account of your objectives, financial situation or needs. It is not to be construed as a solicitation or an offer to buy or sell any financial instruments, or as a recommendation and/or investment advice. It does not intend to support an investment decision and it should not be relied upon by you in evaluating the merits of investing in any financial instruments. You should consider your objectives, financial situation and needs before acting on the information in this article. CMC Markets believes that the information in this article is correct, and any opinions and conclusions are reasonably held or made on information available at the time of its compilation, but no representation or warranty is made as to the accuracy, reliability or completeness of any statements made in this article. CMC Markets is under no obligation to, and does not, update or keep current the information contained in this article. Neither CMC Markets nor any of its affiliates or subsidiaries accepts liability for loss or damage arising out of the use of all or any part of this article. Any opinions or conclusions set forth in this article are subject to change without notice and may differ or be contrary to the opinions or conclusions expressed by any other members of CMC Markets.