This article is brought to you by TradingView
- CFD Knowledge Hub
- TradingView
- Beyond the noise: a technical overview of Bitcoin
Beyond the noise: a technical overview of Bitcoin

Table of contents
- 1.What Bitcoin teaches us
- 2.From big picture to actual trade
When approaching trading and investing, you’re immediately overwhelmed by a sea of news, indicators, and data. Distilling what’s truly useful for building a winning strategy is no easy task.
Adopting the right mindset is essential to finding your way. Let’s set aside the jungle of complex patterns and exotic indicators for a moment and focus on the few key concepts that really make a difference in constructing a trade.
Opportunities abound in today’s uncertain geopolitical and economic climate, but they come with risk. Choosing the right markets at the right time is crucial. Let’s take Bitcoin as an example.
At the time of writing, the price has firmly exceeded $100,000, rising from previous highs around $60,000 (see red line in the chart below).
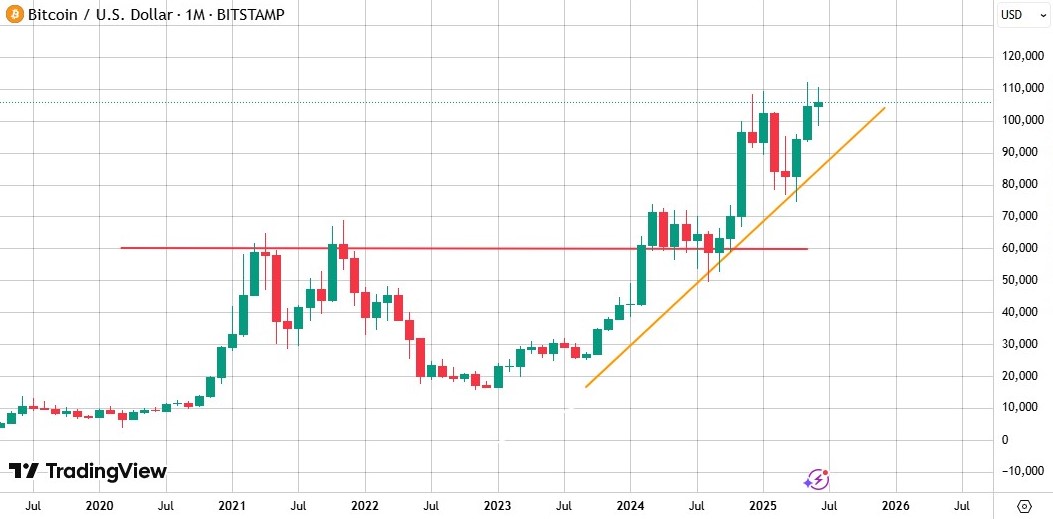
Source: TradingView. The chart illustrates Bitcoin surpassing all-time highs in 2025. Provided for illustrative purposes only.
Entering a long position in a market that has already seen such a prolonged rally is risky - especially one as volatile as Bitcoin. So, how can we assess if there’s still room for further growth? This is where technical analysis and the study of historical data can provide statistical support.
One key tool is the RSI (Relative Strength Index), an oscillator that measures the ratio between average “positive” and “negative” days within a given period (usually 14 days on a daily chart), normalising the result on a scale from 0 to 100.
The RSI helps evaluate an asset’s strength or weakness based on the speed and magnitude of recent price movements. High values indicate an overbought market and low values an oversold one.
For example:
RSI > 90: market is “overheated,” suggesting possible short-term bearish reversal
RSI < 30: market is oversold, indicating a possible short-term bullish reversal
What Bitcoin teaches us
Applied to a monthly Bitcoin price chart, the RSI reveals a clear pattern:
2021–2022 bull run: once the RSI exceeded 90 (see red line), the price was unable to reach new highs and began to correct (see two black arrows on the left in the chart).
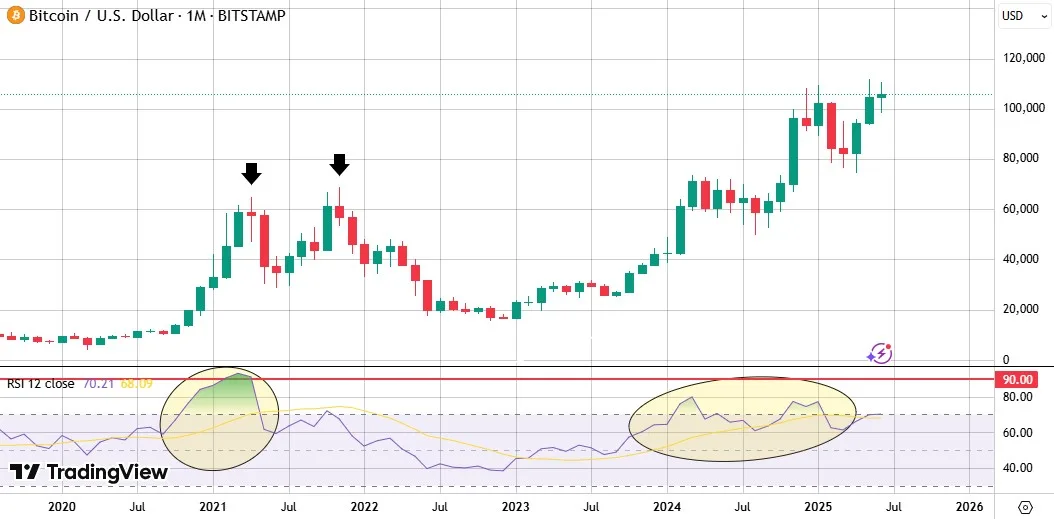
Source: TradingView. The chart illustrates Bitcoin's price action alongside RSI signals near overbought conditions in 2017-18. Provided for illustrative purposes only.
2017–2018 cycle: a similar scenario occurred - prices continued climbing after RSI reached 90, but soon after, the market entered a bear phase.
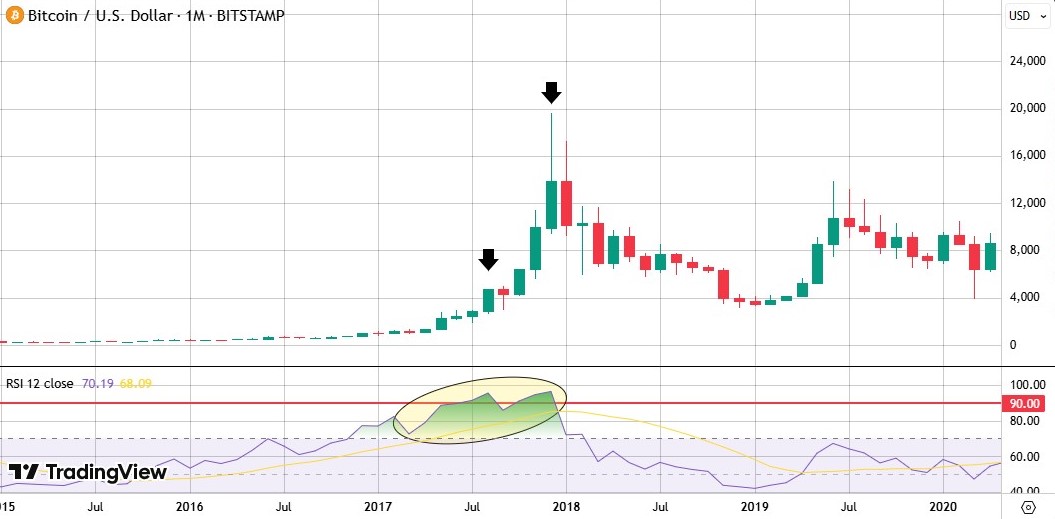
Source: TradingView. The chart illustrates Bitcoin's 2017 rally and RSI peak preceding a sharp market reversal. Provided for illustrative purposes only.
Early cycles (2013–2014): again, the peaks coincided with RSI values above 90. The first arrow on the left marks a peak that may seem modest at first glance, but the price rose from $8 to nearly $250 quickly.)
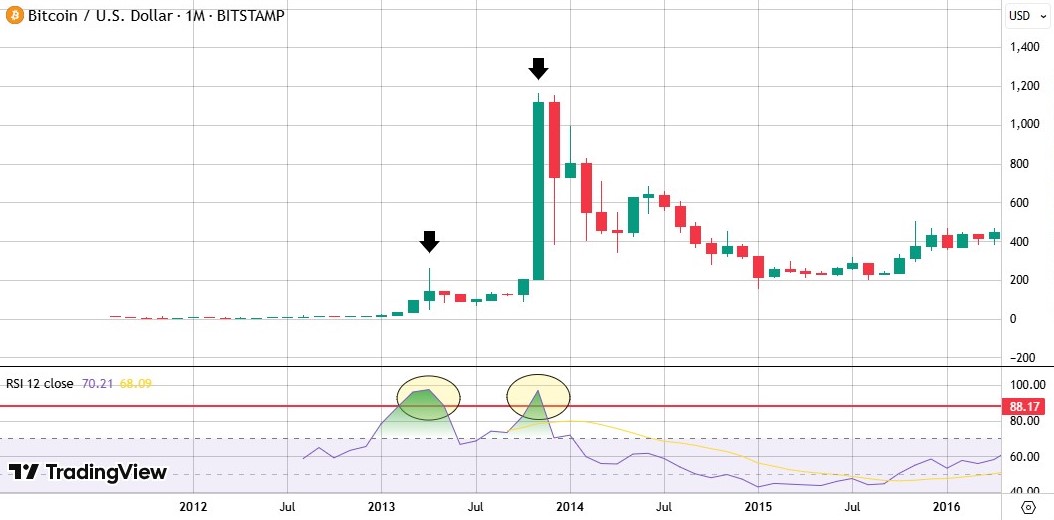
Source: TradingView. The chart illustrates Bitcoin’s 2013 surge followed by an RSI climax and prolonged decline. Provided for illustrative purposes only.
In all of Bitcoin’s bullish cycles, the rally continued at least until the monthly RSI reached the 90 zone. It never reversed hitting that level. Today, RSI is in overbought territory - but still well far from the extreme levels seen in the past cycles. Statistically, this uptrend may still have room to run.
Naturally, RSI alone is not enough. A broader perspective is needed - one that includes Bitcoin fundamentals and those of the global financial markets. For example, a recession in the U.S. or China or the Fed’s interest rate decision could be significant negative catalysts for the BTCUSD rate.
From big picture to actual trade
This is just the first piece of the puzzle in building a profitable trade: identifying a statistical edge in the target market (in this case, using the RSI in a monthly chart).
The next step is to analyse timing and entry points by studying lower timeframes (such as daily charts), depending on your risk tolerance and trade duration. Here, you look for ideal patterns and support/resistance levels.
This type of market analysis is also useful for intraday trading; trend alignment is fundamental.
Understanding the broader market trend indeed helps gain a statistical edge even in short-term operations. In the case we’ve analysed, the bias favours long positions. Short positions should be reserved for special situations, with full awareness of the higher risk involved.
Disclaimer: TradingView Inc. (TradingView) is a third-party provider. Any Orders you place on the TradingView System will be transmitted to and executed through the CMC Markets Next Generation Platform in accordance with the PDS, the Terms and Conditions of Trading, and any other relevant CMC Markets documents, to include the CMC Markets - Third Party Terms and Conditions - TradingView. Please see these documents at cmcmarkets.co.nz. Prices displayed within the TradingView System are indicative only. Any information contained on the TradingView System is provided by TradingView and has not been verified by CMC Markets. CMC Markets shall not be held responsible for any loss that you may incur, either directly or indirectly, arising from any investment based on, or otherwise as the result of the correctness, completeness, accuracy or timeliness of the information provided by TradingView.
Join an award winning CFD providerPractise CFD trading with $10,000 of virtual funds on a risk-free demo account.Access 12,000+ instruments on our award-winning CMC Markets Platform. Including indices, forex and shares.Enhance your CFD trading on MetaTrader4 with CMC Markets and access 175+ forex pairs.Tight spreads and low margin rates.

