This article is brought to you by TradingView
- CFD Knowledge Hub
- Trading guides
- How multi-timeframe analysis can sharpen your trading strategy
How multi-timeframe analysis can sharpen your trading strategy

Table of contents
- 1.MTFA methodology
- 2.Advantages of MTFA
- 3.Common mistakes in MTFA
Multi-timeframe Analysis (MTFA) is a trading methodology that involves analysing an asset across multiple time horizons.
The goal is to combine a macro perspective of long-term trends with the precision of short-term timeframes.
MTFA methodology
This methodology allows traders to:
Align their trades with the dominant market direction, reducing the risk of going against the long-term trend and thus increasing the probability of a successful trade.
Filter out market “noise” — once the primary trend is identified, patterns on lower timeframes become more stable and easier to spot.
Define risk/reward ratios with greater precision, making it easier to identify support and resistance levels and set more accurate stop-loss and take-profit orders.
MTFA follows a top-down approach, starting from higher timeframes and working down to smaller ones:
The highest timeframe (monthly or weekly) defines the macroeconomic context, with long-term trends and major support/resistance zones.
The intermediate timeframe (daily) identifies the setup or pattern you want to trade.
The lowest timeframe (4-hour or 1-hour) optimises entry points, stop-losses and take-profits.
Advantages of MTFA
Keeps the chart clean: only key support/resistance levels from higher timeframes are marked.
Reduce complexity: minimal indicators are used; adding too many timeframes can create confusion without improving signal quality.
Repeatable strategy: MTFA's systematic nature allows you to define clear rules and track performance, making the strategy more robust.
Common mistakes in MTFA
Waiting for perfect alignment across all timeframes can lead to missed opportunities.
Ignoring higher timeframes increases the risk of trading against the prevailing trend.
Overreacting to small intraday market moves — MTFA requires allowing for normal market fluctuations. For example, even if entries and exits are based on an intraday timeframe (4-hour or 1-hour), position management is typically guided by the intermediate timeframe (daily).
Practical example
Let’s apply multi-timeframe analysis to an example using Tesla stock. We’ll review the monthly, weekly, daily and hourly charts in turn, highlighting the key levels and patterns that emerge on each timeframe.
Monthly chart: the red line outlines the long-term trend, while the red line marks previous all-time highs, tested twice as strong resistance. These levels may act as areas of interest for traders, as they represent previous points of strong resistance.
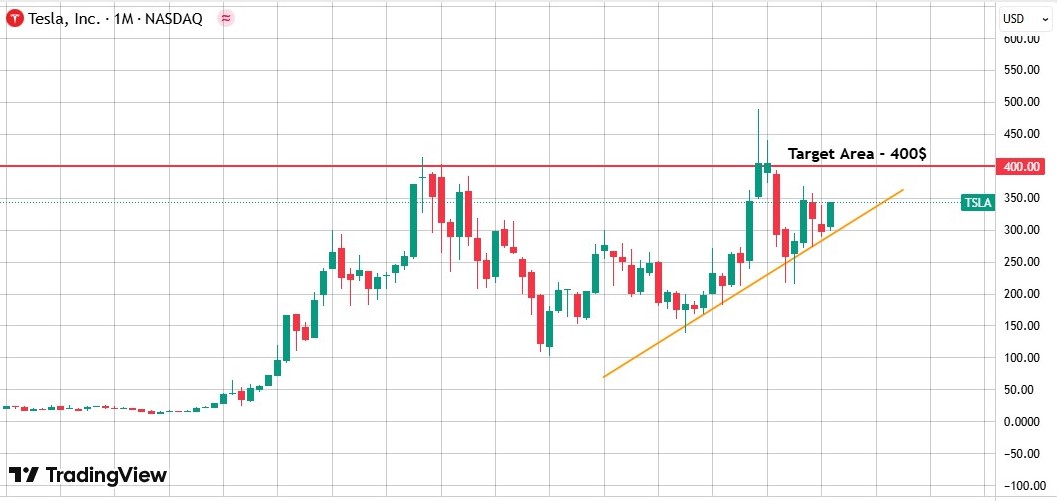
Source: TradingView. Past performance is not a reliable indicator of future performance. Images provided for illustrative purposes only.
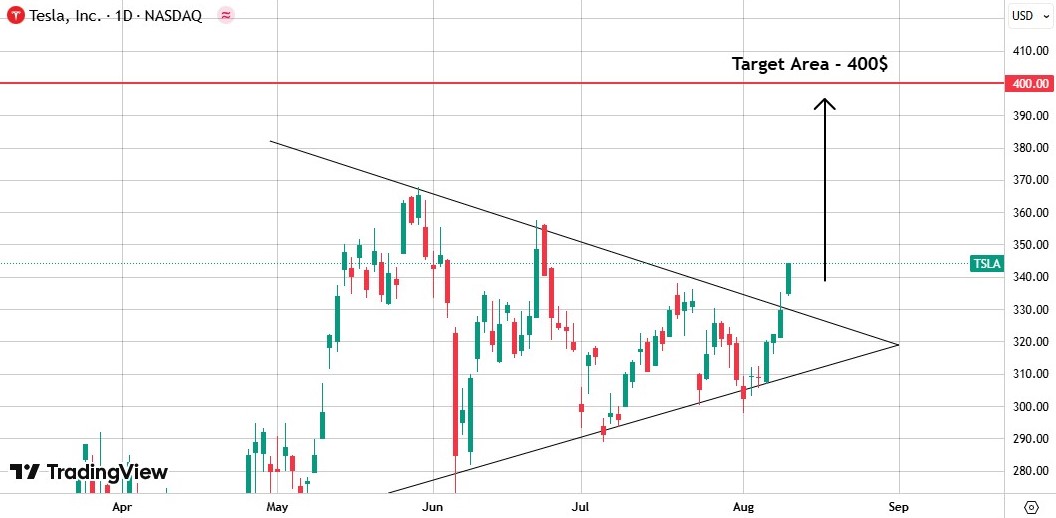
Weekly chart: Price action has compressed into a wedge pattern, often preceding a sharp breakout. Since the monthly chart shows an upward trend, some traders may look for long setups, though risks of resistance and trend reversal remain.

Source: TradingView. Past performance is not a reliable indicator of future performance. Images provided for illustrative purposes only.
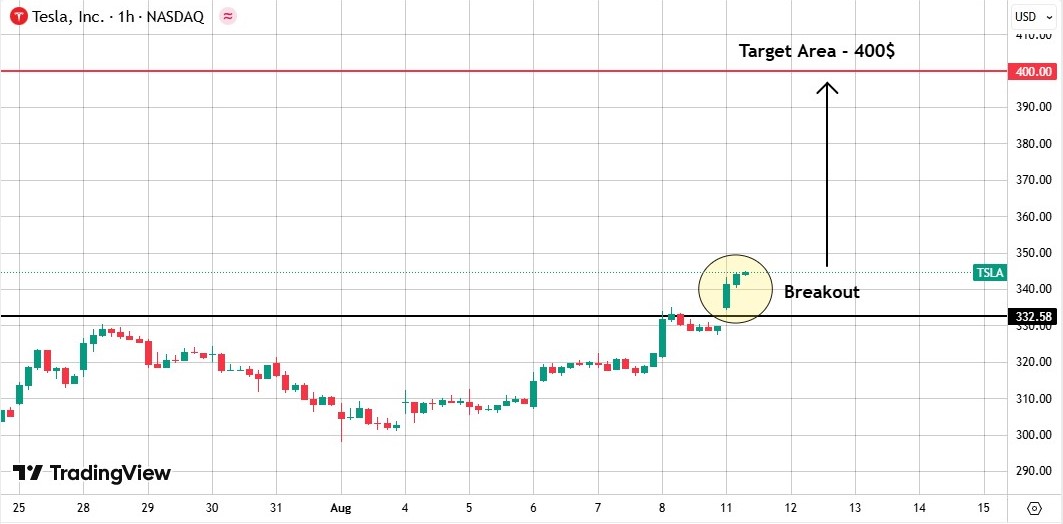
Daily chart: The wedge has already broken decisively to the upside. A possible plan is to wait for a retest of the wedge to confirm the move’s strength.
Source: TradingView. Past performance is not a reliable indicator of future performance. Images provided for illustrative purposes only.
Hourly chart: The breakout level is visible in detail. After several hours, the price retraces toward support. If the retest holds, a buy entry could be taken.
Source: TradingView. Past performance is not a reliable indicator of future performance. Images provided for illustrative purposes only.
Using TradingView’s Long/Short Position tool, we could set stop-loss levels at the previous support area and a potential take-profit at around $400.
The tool immediately calculates key metrics such as theoretical profit/loss and the risk/reward ratio, which would be nearly 4:1 in this case.
A trader might also consider a wider stop-loss to allow for potentially larger gains if previous all-time highs are broken, but this would require broader analysis of macroeconomic factors and Tesla’s fundamentals.
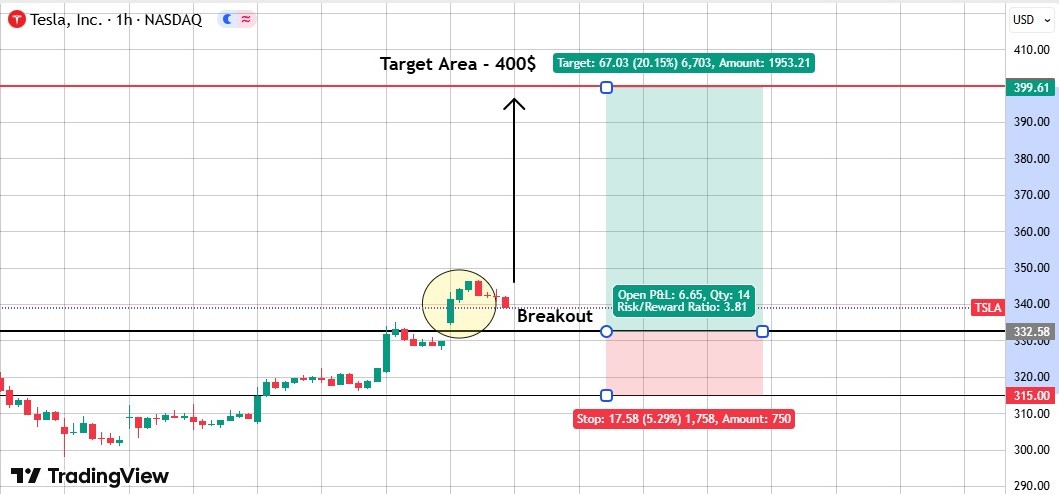
Source: TradingView. Past performance is not a reliable indicator of future performance. Images provided for illustrative purposes only.
Conclusion
MTFA is a powerful tool for building trading strategies, offering a clearer view of market conditions and the levels to watch. It is highly customisable, but adding unnecessary complexity often does more harm than good. When developing a trading plan, many traders find it helpful to use a clear framework and focus on simplicity, as this may assist with maintaining consistency in their approach.
Disclaimer: TradingView Inc. (TradingView) is a third-party provider. Any Orders you place on the TradingView System will be transmitted to and executed through the CMC Markets Next Generation Platform in accordance with the PDS, the Terms and Conditions of Trading, and any other relevant CMC Markets documents, to include the CMC Markets - Third Party Terms and Conditions - TradingView. Please see these documents at cmcmarkets.co.nz. Prices displayed within the TradingView System are indicative only. Any information contained on the TradingView System is provided by TradingView and has not been verified by CMC Markets. CMC Markets shall not be held responsible for any loss that you may incur, either directly or indirectly, arising from any investment based on, or otherwise as the result of the correctness, completeness, accuracy or timeliness of the information provided by TradingView.
Join an award winning CFD providerPractise CFD trading with $10,000 of virtual funds on a risk-free demo account.Access 12,000+ instruments on our award-winning CMC Markets Platform. Including indices, forex and shares.Enhance your CFD trading on MetaTrader4 with CMC Markets and access 175+ forex pairs.Tight spreads and low margin rates.

