What are the death cross and golden cross trading signals?
The death cross and golden cross are technical analysis terms for when a moving average (MA) intersects with another from either above or below. These technical charting patterns can occur in stocks, forex, ETFs and other financial markets.
The cross, depending on which it is, can signal the start of a new trend or the end of one. In this article, we explain how to identify and interpret a golden cross from a death cross, as well as the strategies for executing trades with them.
The death cross and golden cross are simple technical analysis indicators that alert traders when a price trend may be turning bearish or bullish.
The indicators use both 200-day and 50-day MAs to signal whether a death cross or golden cross has occurred. When the 50-day MA crosses above the 200-day MA from below, this is a golden cross. Meanwhile, a death cross is when the 50-day MA is above the 200-day MA and then crosses below the 200-day MA.
A golden cross indicates that prices may be starting to rise in a new uptrend and, therefore, a long position may be preferred by traders. Once a death cross occurs, the price of the asset is potentially starting a new downtrend, which could mean that short selling or exiting long positions would be preferred by traders.
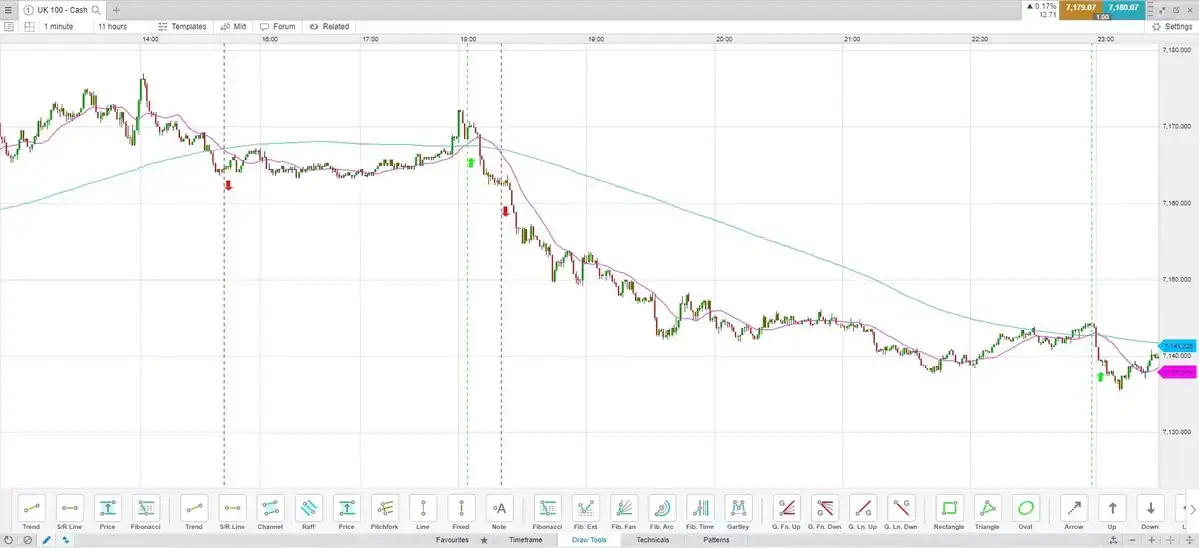
Since these are longer-term MAs, the signals are not typically used for day trading. However, the same concept could be applied to a one-minute chart with 200-minute and 50-minute MAs.
The 200-day and 50-day MAs are not set in stone. A trader may opt to use different MA time horizon lengths. In that case, a death cross is when the shorter timeframe moves below the longer timeframe, and the golden cross is when the shorter one moves above the longer one.
EMA vs SMA for cross signals
Simple moving averages (SMA) calculate the average of price data over the period. They are the more widely used MA, although each trader can decide for themselves which type of moving average they prefer. One is not better than another.
The calculation for an exponential moving average (EMA) places a higher weighting on recent price action than an SMA does. This means that an EMA reacts more quickly to price changes. For example, if the price of an asset drops, a 200-day EMA will start to turn down before a 200-day SMA. This means the SMA is slower to react to price changes.
Both are useful in that they are both providing slightly different information. Traders and investors usually pick one type of MA and stick with it.
Common crossover timeframes for golden cross and death cross trading signals
Investors often use these signals on a daily price chart since the death cross and golden cross use 200-day and 50-day MAs.
Traders are not confined to these parameters. They may opt to use 200-period and 50-period MAs on any timeframe of their choosing. Applying these indicators to a one-minute or five-minute chart would provide short-term trade signals and highlight potential short-term changes in direction.
An hourly or 4-hour-chart would provide slightly longer-term signals of trend changes, over weeks and months typically. Applied to a weekly chart, the MA would highlight trend changes over the course of many years in some cases.
The time periods of 200 and 50 could also be altered. Some traders prefer using a 100 and 20, or 50 and 10. The idea is the same. When the shorter-term MA crosses the longer-term one, it may signal that a trend change is underway on that timeframe.
Golden cross trading example
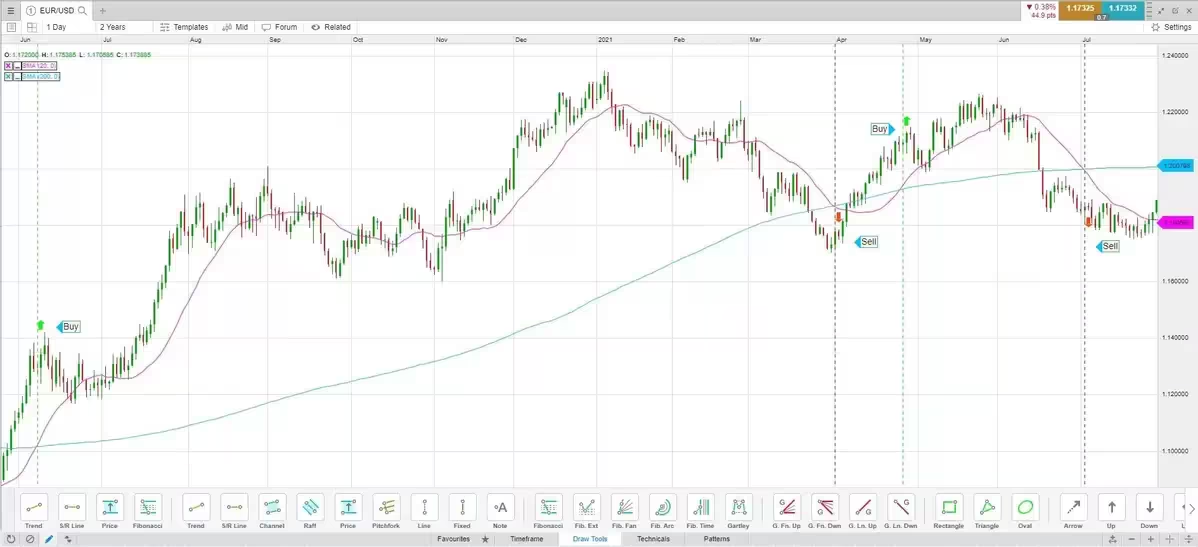
The chart below shows two examples of a golden cross in the currency pair EUR/USD.
The first buy signal occurs when the 50-day MA crosses above the 200-day MA based on a daily close. A trade is placed at the start of the next price bar at 1.1294. The trade remains open until the 50-day MA crosses back below the 200-day MA.