Let us start this week with a high-level view of our asset classes. The samples in the Relative Rotation Graphs™ are taken weekly.

There is a clear message in the chart above: commodities rule. The Dow Jones UBS Commodity Index (DJP) is furthermost to the right compared to the benchmark at the chart’s mid-point, the Morgan Stanley Capital International World Index (MXWO).
Below that, the iShares Gold ETF (IAU) is also relatively stronger than the MXWO.
The DJP and IAU are falling in a south-easterly direction, meaning that they have lost some relative momentum, but the ratio is resuming. Given that they are so far to the right, this does not cause concern. They should remain the best assets on the board for a while longer.
Bunched in the middle is everything else. Interest rates and emerging markets are all moving with the benchmark and each other. Assets that move together do not offer any relative advantage.
Before we break down the commodities group, let us take our weekly look at world stock indices.
Major global indices
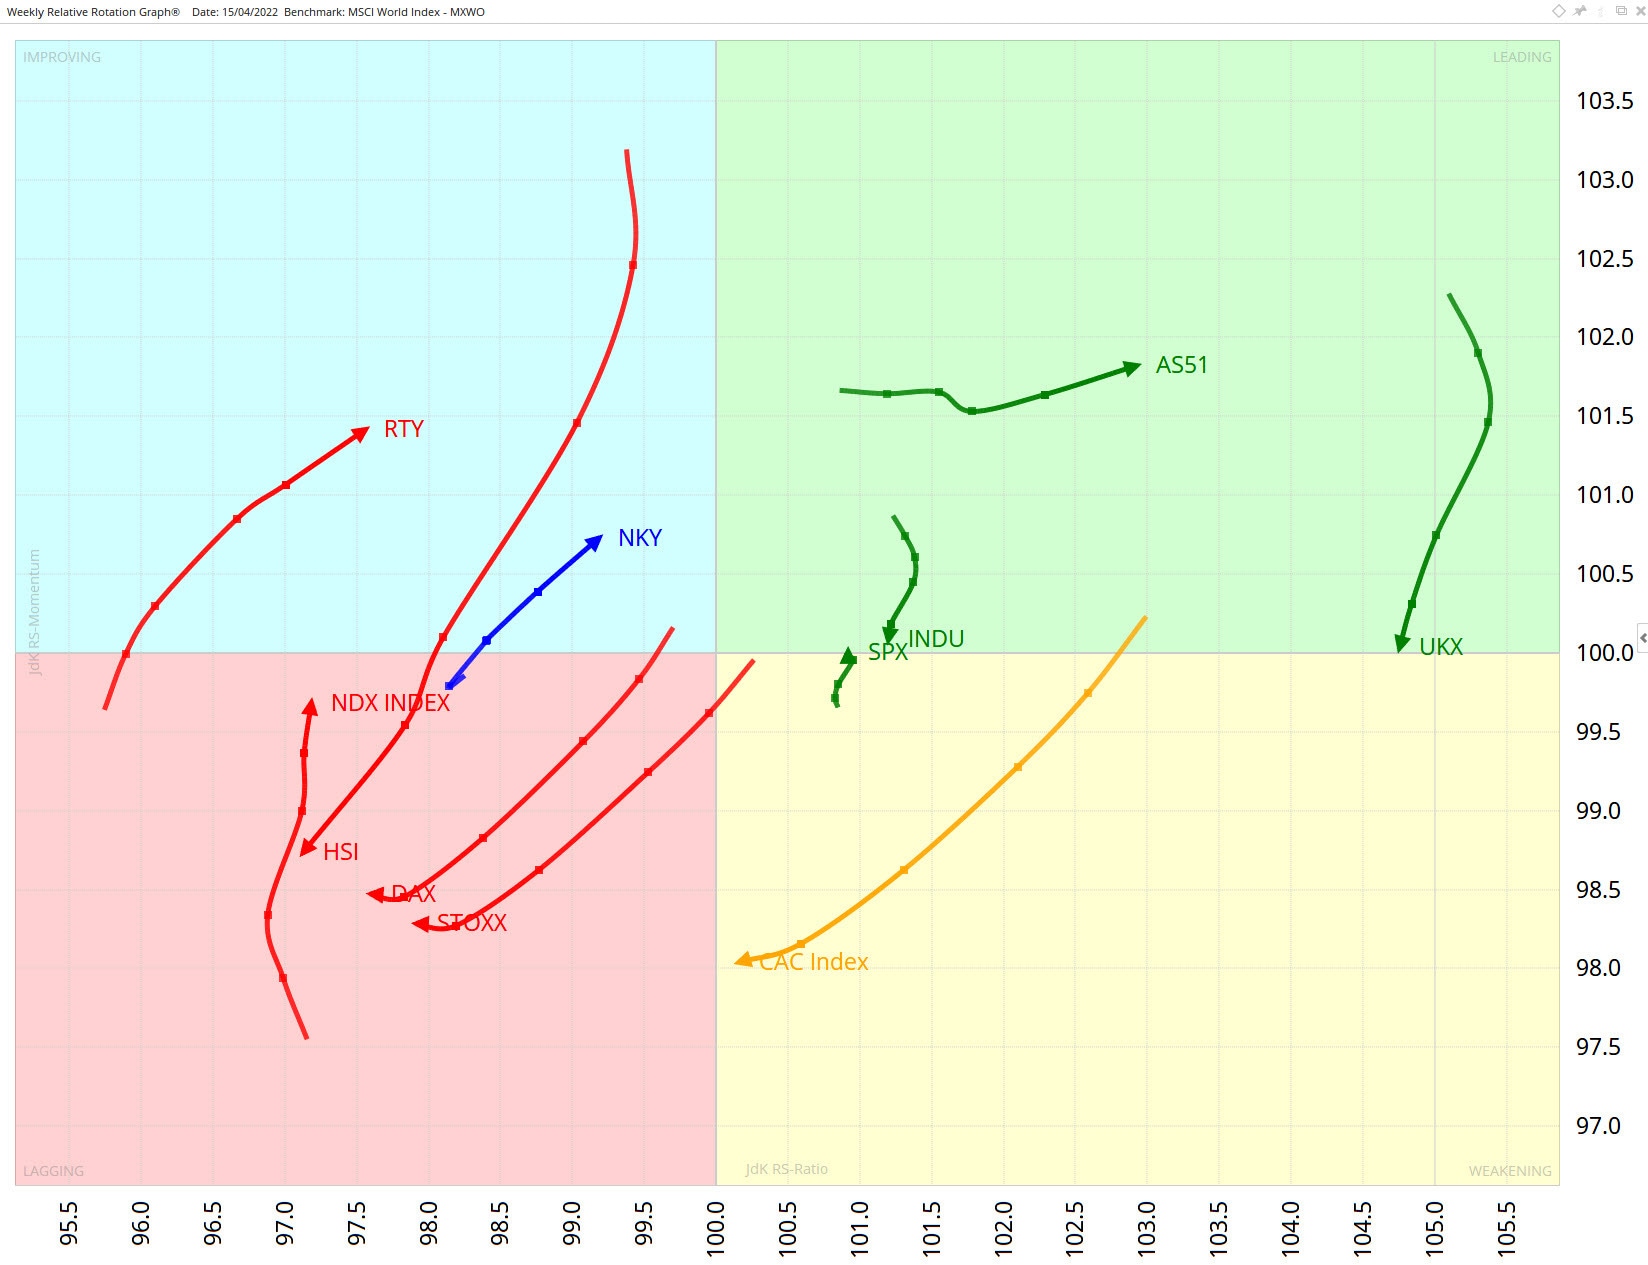
The weekly Relative Rotation Graph (RRG) above shows the rotation for major world stock market indices against the MSCI World Index at the centre of the chart.
Several tails have weak rotations, including Hong Kong’s HSI, Germany’s DAX, Europe’s STOXX, and France’s CAC. On this weekly RRG, all of them are travelling in a negative, south-west direction and are in or heading towards the lagging quadrant.
Meanwhile, the UKX tail is inside the leading quadrant. Its tail is losing relative momentum in relation to JdK RS-momentum on the Y-axis, but at a much higher level of relative strength, suggesting that it is a temporary setback within a longer term rising relative trend.
Energy commodities lead the way
The RRG chart below compares commodities futures markets to the Commodity Research Bureau (CRB) index, which is a basket of 19 commodities, including agricultural products as well as precious and industrial metals. The sampling is weekly.

The strength of the commodities asset class is being driven by energy, with WTI crude oil (CL1), gasoline (XB1) and heating oil (HO1) in the top-right leading quadrant.
One energy contract not in the leading quadrant is natural gas (NG1). This is moving north-east in the top-left improving quadrant. Its RS-ratio is below zero, heading east towards the leading quadrant. It is also heading north, indicating increasing RS-momentum. Note that the tail is long, with the last sample space being the largest in the tail, meaning that it is heading north-east faster.
The commodity furthest to the right in the above chart is nickel (LN1).
On the left, copper (HG1) and the precious metals are below 100 on the RS-ratio, indicating that they’re weighing on the asset class. All the soft commodities are in the bottom-left lagging quadrant.
Natural gas prices are heating up
Many energy contracts have shot up. They were moving up before Russia’s invasion of Ukraine, but the war has driven them even higher. This is especially true of natural gas (NG1), which, as the below chart illustrates, has just broken from a 13-year base during which it traded in a range between $2 and $6.

Often, breaks from broad bases support big moves. The fall in July 2008 shows the collapse into the era of cheap US gas. Now the price of natural gas seems to be entering a new era, supported by the base line highlighted in the chart. We may be looking at a long-term restructuring of natural gas prices. As the chart suggests, natural gas appears to have long-term growth potential.
CMC Markets er en ‘execution-only service’ leverandør. Dette materialet (uansett om det uttaler seg om meninger eller ikke) er kun til generell informasjon, og tar ikke hensyn til dine personlige forhold eller mål. Ingenting i dette materialet er (eller bør anses å være) økonomiske, investeringer eller andre råd som avhengighet bør plasseres på. Ingen mening gitt i materialet utgjør en anbefaling fra CMC Markets eller forfatteren om at en bestemt investering, sikkerhet, transaksjon eller investeringsstrategi. Denne informasjonen er ikke utarbeidet i samsvar med regelverket for investeringsanalyser. Selv om vi ikke uttrykkelig er forhindret fra å opptre før vi har gitt dette innholdet, prøver vi ikke å dra nytte av det før det blir formidlet.

