Australia’s leading index, the ASX (AS51), is on the up. The weekly Relative Rotation Graph (RRG) for world markets, below, shows the ASX pushing into the leading quadrant. It is gaining on both axes relative to the MSCI World Index, backed by strong momentum. The length of the tail indicates that there is power behind the upwards move.
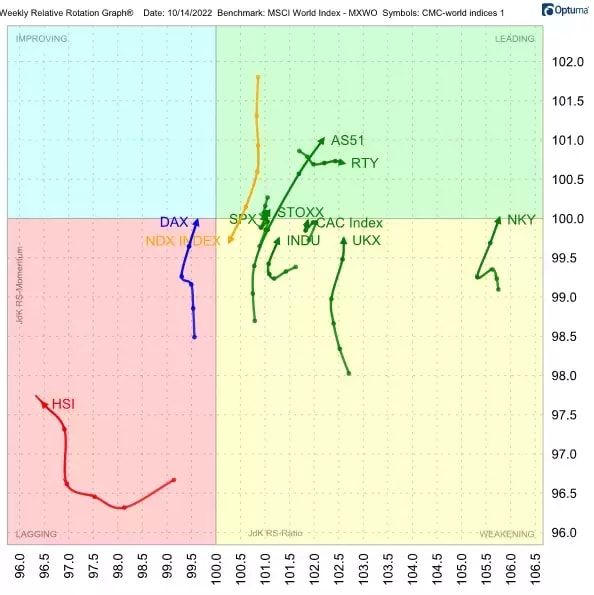
Japan’s Nikkei (NKY) also remains strong, having returned to the leading quadrant after a rotation through the weakening quadrant. Meanwhile, Hong Kong’s Hang Seng index (HSI) has moved further into the lagging quadrant.
Australian market enters rally
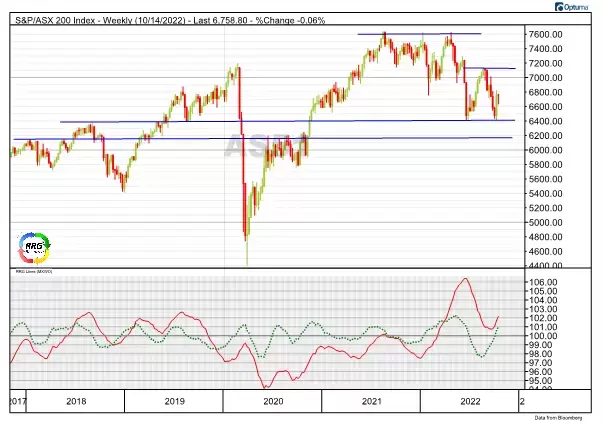
Having bottomed at the level of the previous low around 6,400, Australia’s ASX 200 is now rallying off that low and could possibly reach resistance at the level of the previous peak near 7,100.
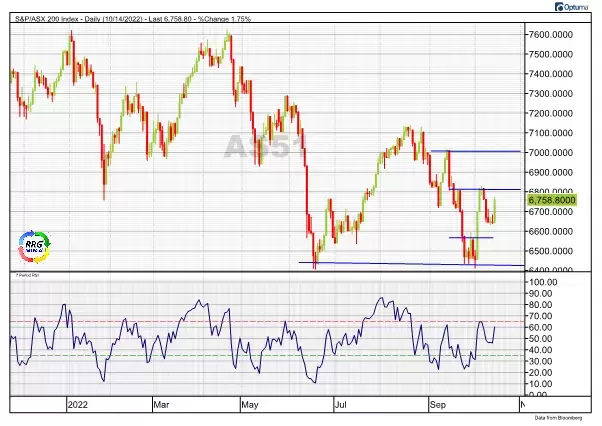
The daily chart, below, shows that the test of support around the 6,400 mark lasted for six days and took the shape of a small double bottom. After the initial rally, a new higher low was put in place around 6,650. A break above 6,800 would confirm ASX's current strength and could even trigger a further rally towards the 7,000-7,100 region.
Three stocks emerge from our analysis of the Aussie index
Given the strength of the ASX, we scanned the index looking for stocks that are:
• trading above their 10-day simple moving average
• have an RRG heading of 0-90 degrees
• are showing increasing RRG velocity
On Friday 14 October, the following three Australian equities met these criteria:
• Webjet [WEB]
• Eagers Automotive [APE]
• WiseTech Global [WTC]
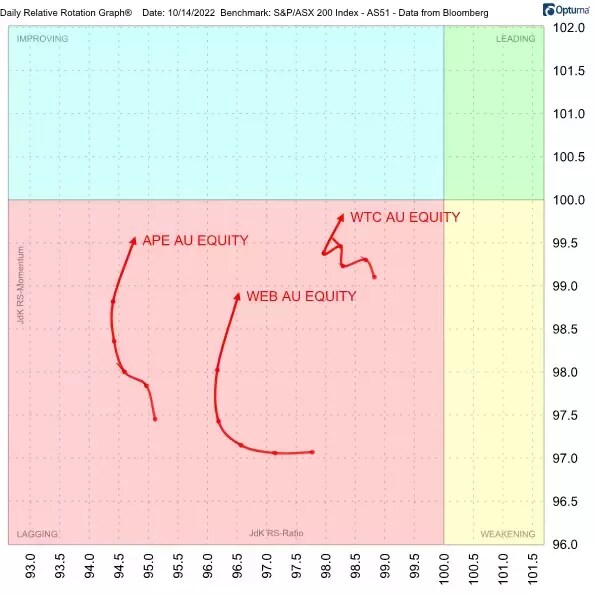
Although these stocks show up in the lagging quadrant when plotted on a daily RRG, as shown below, they are displaying improving relative momentum and are heading in a positive direction. Their increased RRG velocity over the last two days underscores the build-up of strength. After the chart, we take a closer look at these three companies.
Webjet travelling upwards
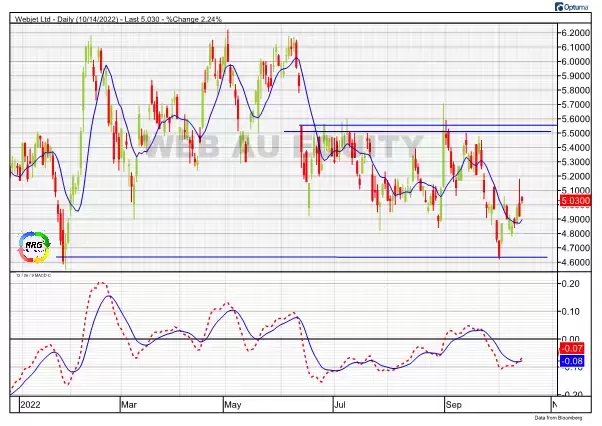
Digital travel company Webjet [WEB] dipped to a low near $4.60 at the beginning of October, finding support at the area it dropped to in January. Out of that low a new uptrend emerged, with the stock hitting a series of higher highs and higher lows. Within the range that has developed since the summer, a return to the upper boundary between $5.50 and $5.55 appears possible.
The move above the 10-day moving average and the upward turn in the moving average convergence divergence (MACD), as shown in the lower portion of the below chart, support a further rise.
Eagers Automotive could drive higher
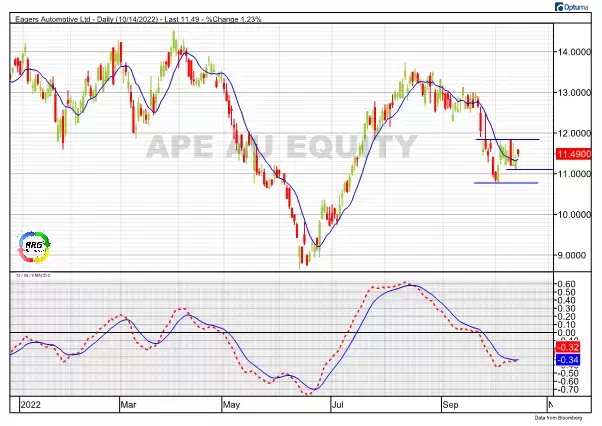
Car dealership group Eagers Automotive [APE] recently posted a higher low as it crossed above its 10-day moving average. As the Relative Rotation Graph above suggests, with the stock in the lagging quadrant, signs of improvement are still in their early stages. If horizontal resistance just below $12 can be overcome, more upside potential could open up.
WiseTech Global fails to convince
Logistics software company WiseTech Global [WTC] is the least convincing of the three stocks that emerged from our scan of Australia’s ASX index. Although the stock ticks the boxes for inclusion, its price chart offers little sign of an imminent upturn.
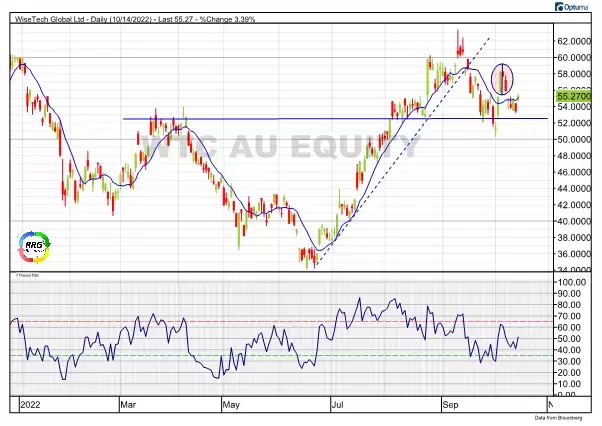
Only a month or so ago, WTC broke below its rising trend line, signalling the end of an uptrend. The recent high at $58 was the first lower high after that break. The rally towards that lower high emerged out of a test of support just above $52, and the peak was completed with an island reversal (see circled area). An island reversal is a cluster of one or more candles, with a gap going in and a gap coming out, setting the candles apart, without overlap, from the rest of the chart. This is usually a weak formation which points to lower prices.
Although the shares broke back up above their moving average yesterday, there is too much overhead resistance to make the stock an attractive proposition. As a matter of fact, a break below the previous lows could well attract a fresh sell-off.
Pricing is indicative. Past performance is not a reliable indicator of future results. RRG’s views and findings are their own and should not be relied upon as the basis of a trading or investment decision.

