Medium-term technical analysis (1 to 3 months)

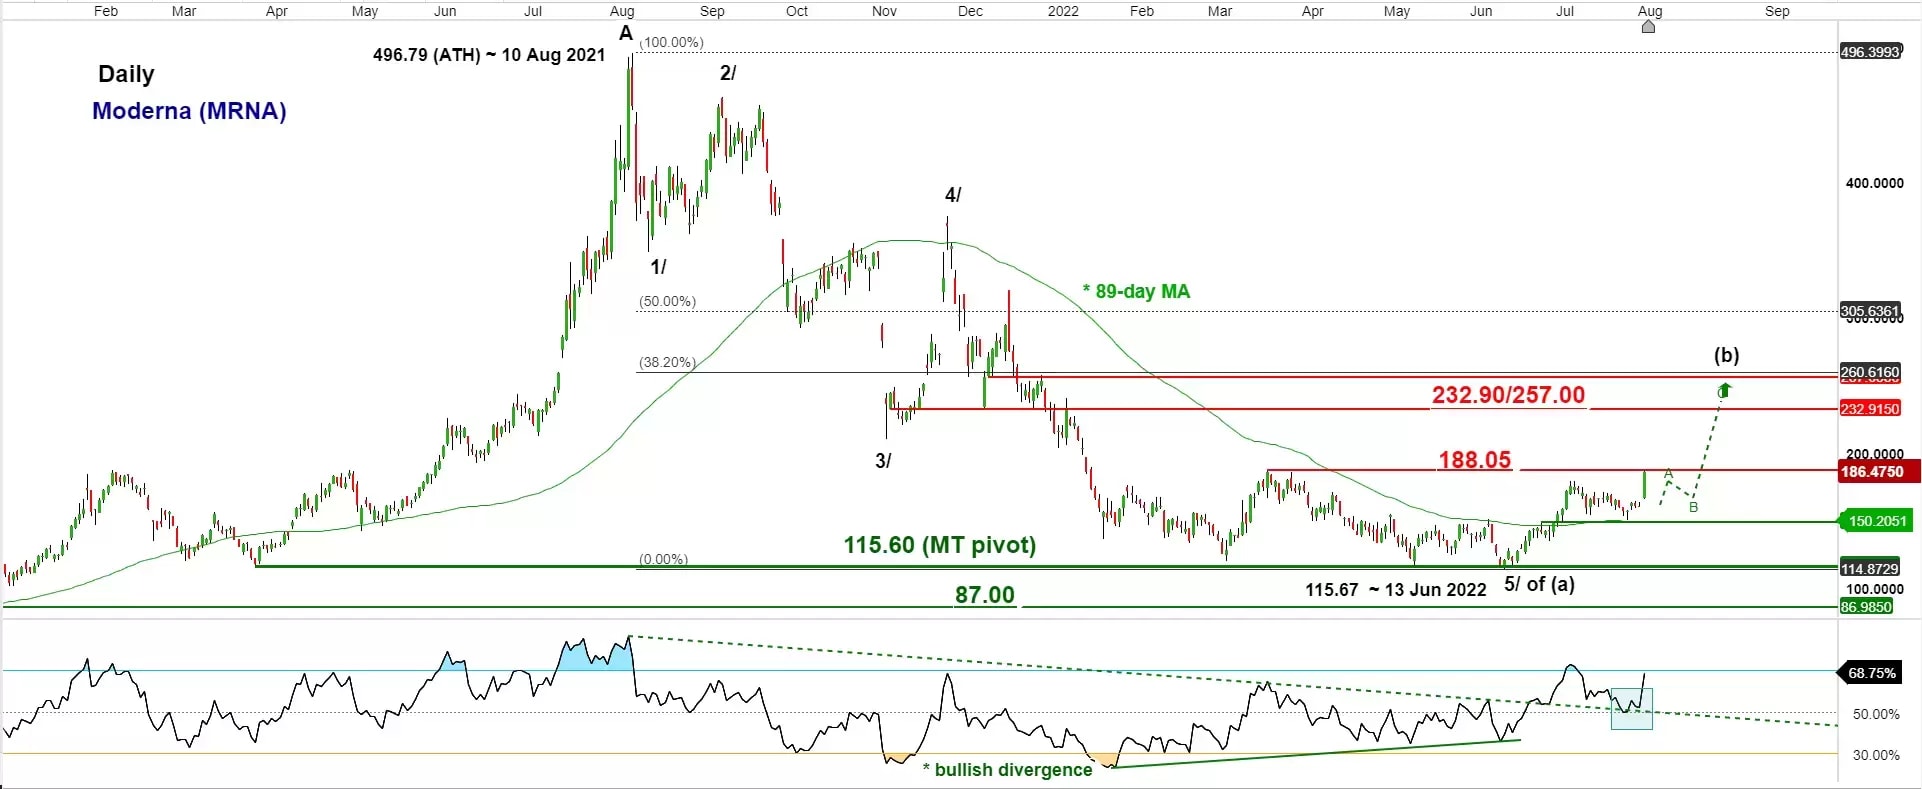
Integrated technical analysis (graphical, momentum, Elliot Wave/fractals) suggests that its major downtrend phase from its 10 August 2021 all-time high of 496.79 that plummeted by -77% to print an intraday low of 115.67 on 13 June 2022 may have reached an inflection level where a potential medium-term basing formation may take shape for Moderna to trigger a multi-month corrective rebound phase to retrace a portion of the major downtrend phase’s losses.
Key Levels (1-3 months/MRNA)
Intermediate support: 149.70
Pivot (key support): 115.60
Resistances: 188.05 & 232.90/257.00
Next supports: 87.00 & 57.45
Directional Bias (1-3 months/MRNA)
Watch the 115.60 key medium-term pivotal support and clearance with a daily close above 118.05 reinforces another leg of potential corrective rebound towards the next resistance zone of 232.90/257.00.
On the other hand, failure to hold at 115.60 with a daily close below it ignites another round of impulsive down move sequence towards the next supports at 87.00 & 57.45 (also swing low areas of 2 June/2 July/8 September 2020).
Key elements for Moderna's share price
- Elliot Wave/fractal analysis has indicated the completion of a major cycle down move sequence labelled as 1/, 2/, 3/, 4/, and 5/ since its 10 August 2021 all-time high of 496.79 which indicates a probable terminal point of this major cycle down move has been reached on 14 June 2022 (potential end of the major downtrend phase).
- The daily RSI oscillator has shaped a bullish breakout above its key corresponding descending resistance at the 50% level on 1 July 2022 and retested it recently on 28 July 2022. It has also shaped a prior bullish divergence signal at its oversold region on 13 June 2022. These observations suggest a revival of medium-term upside momentum.
- Price actions have surpassed the 89-day moving average that has capped prior recoveries in price actions since 30 November 2021. Also, the recent pull-back in price actions has managed to test and shaped a bounce off the 89-day moving average on 28 July 2022 now acting as intermediate support of 149.70.
- The 232.90/257.00 medium-term resistance zone is defined by the former swing low area of 5 November/10 December 2022 and the 38.2% Fibonacci retracement of the major downtrend phase from 10 August 2021 low to 13 June 2022 low.


