The fantastic uptrends in US stock indices and the Euro have dominated trading so far this year. Both trends will be tested by tomorrow’s FOMC meeting. However, this could produce a long awaited pull back and a buying opportunity.
Background to the FOMC meeting

The case for more aggressive Fed action has strengthened over recent months. Consumption and confidence are robust; tax cuts have added a sharp dose of fiscal stimulus and the Dollar has been getting weaker. This all suggests the Fed can keep lifting rates without harming growth.
The market goes into the February FOMC meeting pricing a 90% probability of a rate hike in March. It is expecting the Fed to signal this tomorrow.
However, the question of how many rate hikes we will see over the whole of 2018 is the key market issue
As the table above shows, the market is priced somewhere between two and three. There is a 31% probability of 2 hikes by the December FOMC meeting and a 36% probability of three.
There is also an 18% probability of four rate hikes this year. It would not take too much hawkish talk by the Fed to shift the majority pricing to an issue between three and four
Four rate hikes this year would move the Fed rate to 2.25% and that in turn suggest a 10-year bond yield above 3%. That is an implication that might threaten current stock market valuations.
Chart background
Against this background, chart traders will be guided by price action. A very hawkish scenario could see major supports broken. Unless and until that happens, it may pay to give the current strong trends the benefit of the doubt. Minor pullbacks might provide buying opportunities
US SPX 500 chart

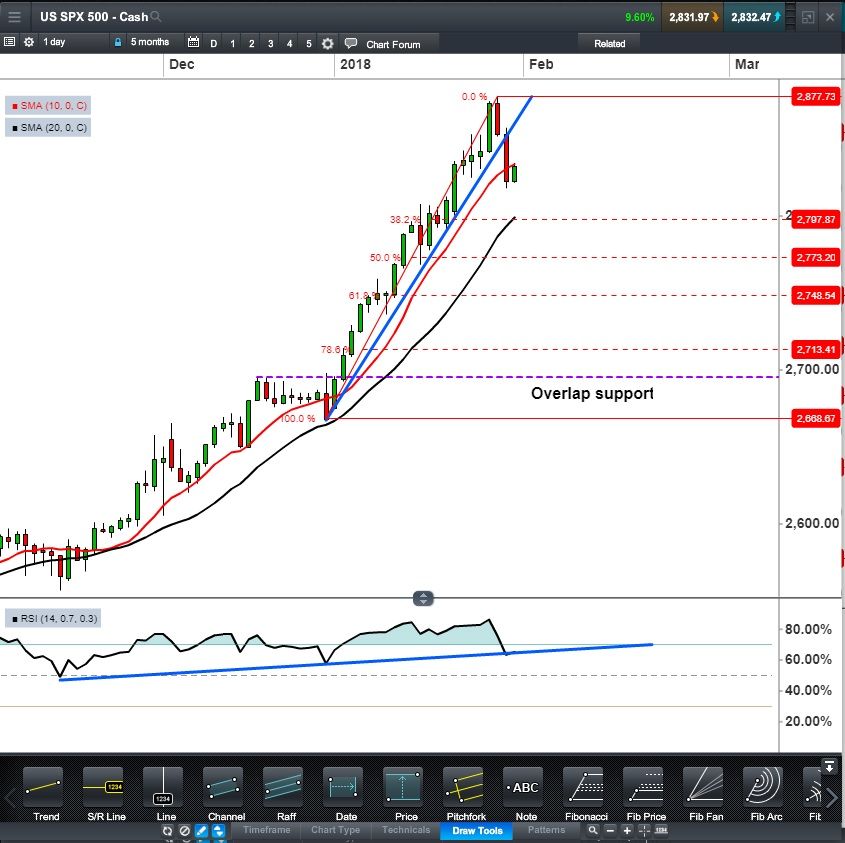
This has finally broken trend line support with last night’s candle making a lower high and a lower low.
The RSI is close to breaking support and could signal a deeper correction.
However, it would take an overlap below the last peak to suggest we are doing any more than correcting the rally from 2668 to 2878.
One initial area of interest for buyers may be the 38.2% retracement and 20-day moving average around 2800
EURUSD chart

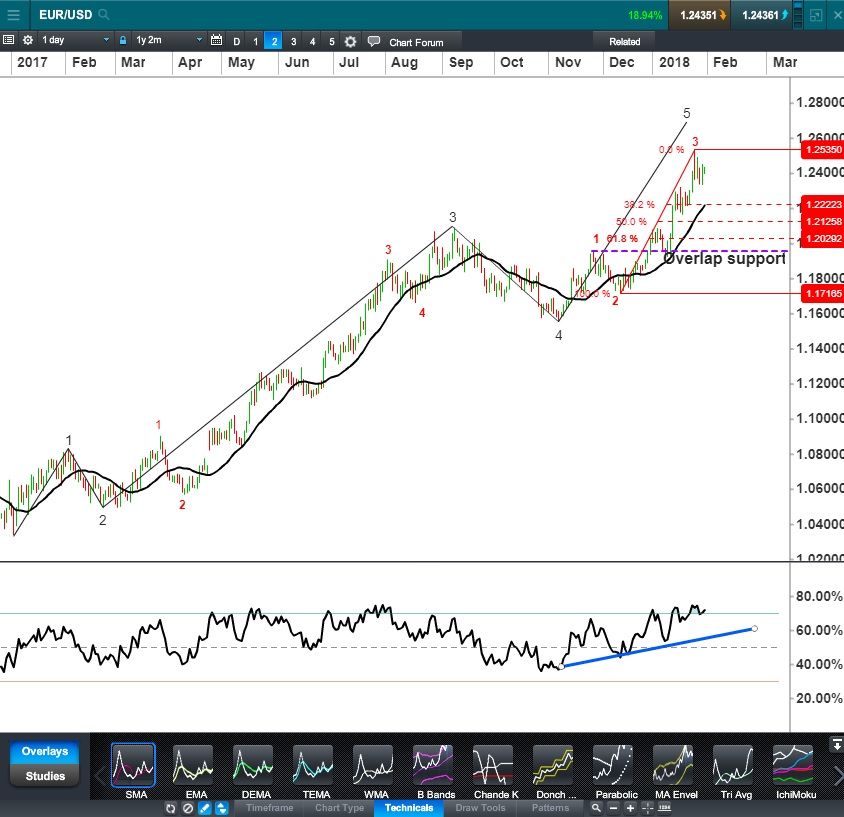
Here the RSI is also still trending up.
Unless the Euro overlaps below the last major peak at 1.192, the safest assumption in my view is that is correcting the rally from 1.1718 to 1.2538.
In a parallel with the SPX chart, the Euro’s 20-day moving average and 38.2% retracement level also coincide. This happens around 1.2222. Again, this may be an initial level of interest for the buyers’ watch list.


