By John Sheridan
Over the past 12 months the US Dollar has been taking a bit of a beating against a basket of currencies, with the USD Index now at a three-year low. In fact the dollar’s decline appears to be the polar opposite of the so-called “Trump Bump” seen in the stock market.
Are these two diverging trends related? Possibly, but as technical traders we are much less concerned with the fundamental reasons for the dollar’s decline and a lot more focused on what the charts are telling us.
With the dollar weak against a selection of currencies, our objective should be to identify currency pairs with the potential to allow us to profit from the USD’s decline. In this regard EUR/USD ticks a lot of boxes and I’ll explain why.
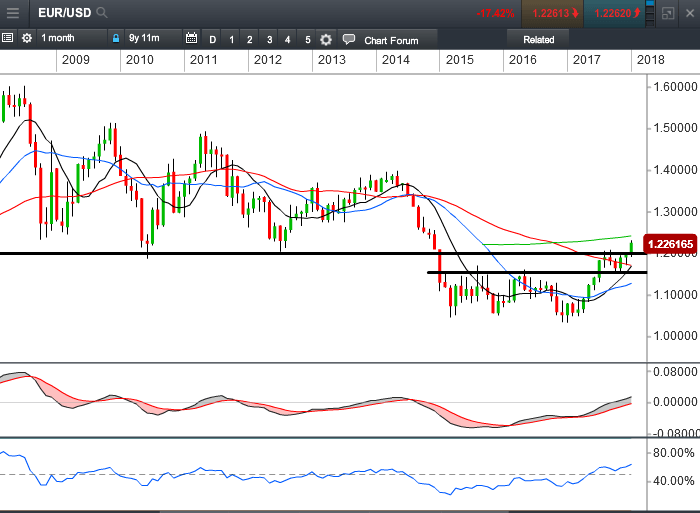
Let’s start by analysing the monthly chart below.

Since its downturn in 2014, the Euro had been trading in a range and struggling to get above resistance at 1.1500. Eventually it broke through and then established an uptrend, before breaking though a key level at 1.2000 in recent weeks with indicator momentum confirming this move.
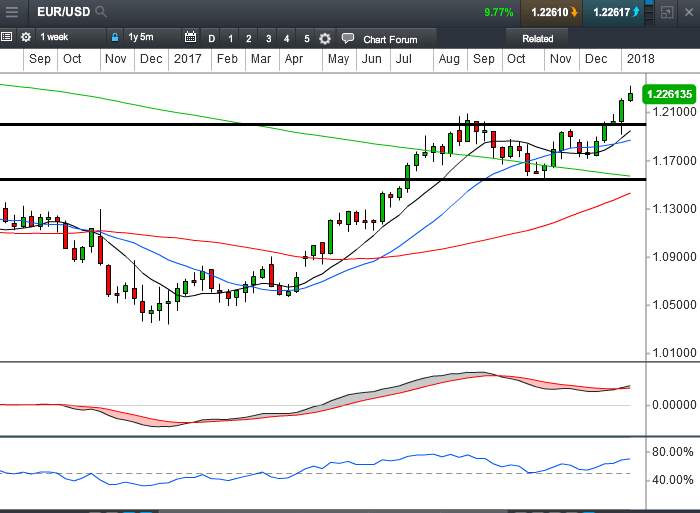
Moving down to the weekly chart below, the move appears even more bullish. We see an elegant chart structure has emerged on this timeframe with a clear uptrend established, and the moving averages (MAs) just about to move into the optimal geometry, the bullish trend momentum is also confirmed by the indicators There doesn’t appear to be any resistance above until we get up to about the 1.4000 level.


However, we need to be mindful that price is currently over-extended from the MAs, indicating that we could be due for a pullback. But this in turn could present us with a potential buying opportunity, which may allow us to participate in the next upswing of this trend.
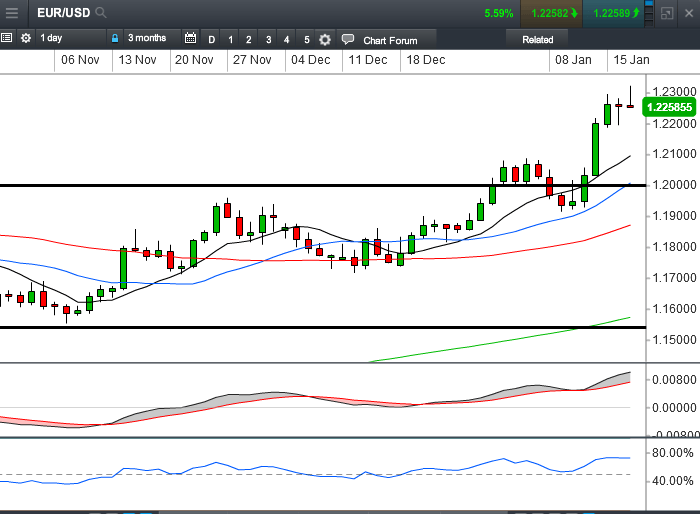
With this in mind, should the price pull back to the area around the 10 and 20 period MA, which also coincides with our key level at 1.2000, I will be looking for potential long setups. If there’s a setup on the daily timeframe I may place an order, although my preference would be for an entry on a lower timeframe, which could give a better risk to reward ratio.


