By John Sheridan, Trade With Precision
The trade war has continued between the US and the rest of the world and is creating potential opportunities for traders in many of the global asset classes. I’d like to focus on one of the most-affected; Soybeans.
Soybeans are generally converted into two products: soybean oil and soybean meal. The US is currently the world’s largest producer and exporter. And China is the world’s largest importer of soybeans, purchasing around 25 percent of the annual US crop. Or at least China did until President Donald Trump began pushing for higher tariffs on Chinese imports, reciprocated by China and other major trading partners.
This scenario has impacted the price of soybeans, which is drawing the attention of traders looking for potential long-term moves. But no matter how strong the fundamental information may be, as a technical trader I tend to only take trades that have multiple technical reasons for entry. Not the least of these is multiple timeframe agreement.
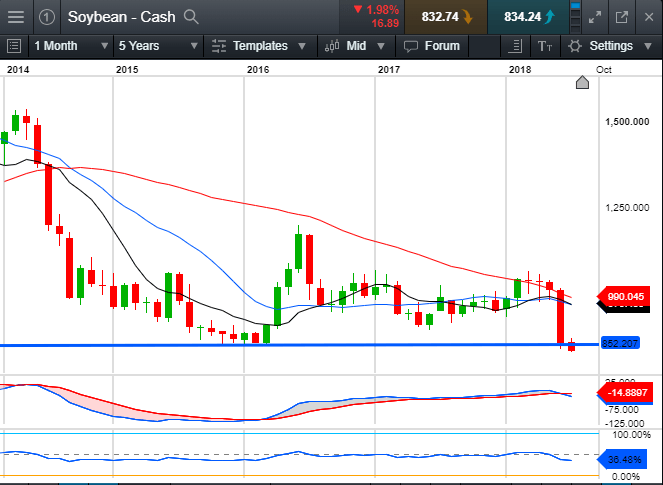
With that in mind, I’ll begin my analysis on the Monthly timeframe below. Here we see that while soybeans aren’t in what I would classify as a downtrend according to my trading philosophy, they have certainly been in a downward trajectory, with a level of support being established at 852, which has now just been breached. The fact that the moving averages (MAs) are coming into alignment is another positive factor.

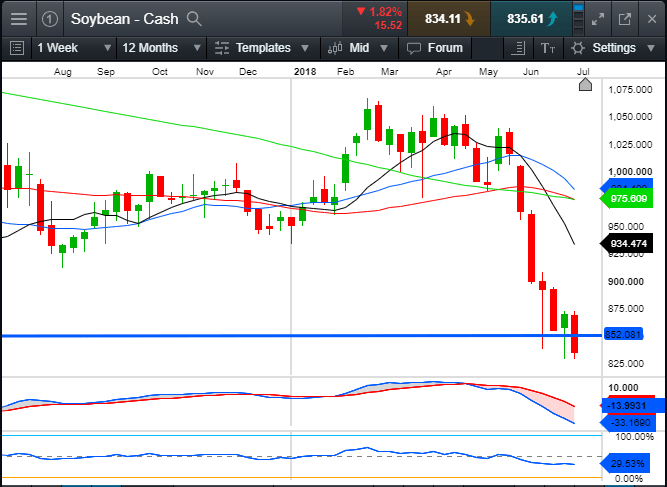
Moving down to the Weekly timeframe (below) we see that price is in a downtrend with the MAs beginning to roll over and form a bearish geometry, with the exception of the slower moving 200 period MA which is yet to conform. On this timeframe, the strength of the recent drop in price is more apparent and the trend momentum is confirmed by bearish convergence on both the MACD and the RSI.

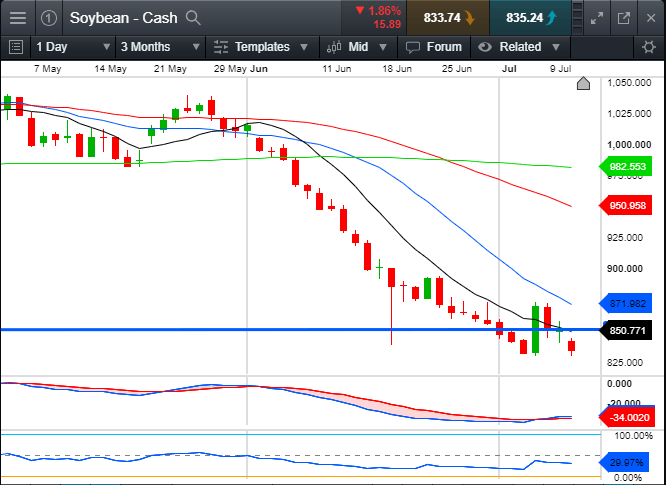
On the Daily chart (below), we see the downtrend with good MA geometry and bearish convergence, again confirming the trend momentum. The 852 support level is in the Sell Zone between the 10 and 20 period MAs, and I will be keeping a careful eye on this level.

I’m looking for a price retracement to this level and then a small bearish candle to form, which could set up a potential short opportunity on the Daily timeframe. In the event that price doesn’t pull back, I’ll be looking for entries on the four hour and one hour charts.
To summarise, the market move here is driven largely by fundamental issues. I am looking for a multitude of technical reasons to set up to allow me to join in on this down trend.


