ByHao Sun, Trade With Precision
The Japanese Yen has received a lift from traders seeking a safe haven from the looming tariff war between the US and China. But will the JPY’s strength be maintained? Let’s take a look at the EUR/JPY cross for some indicators of the likely trends in the coming days.
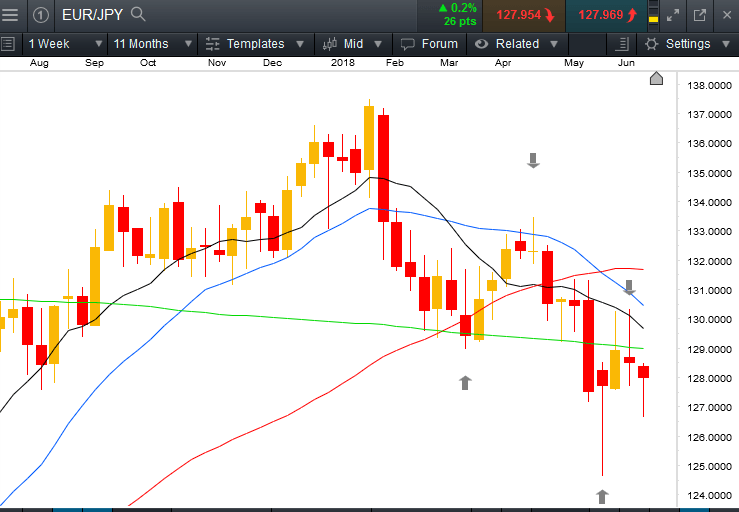
EUR/JPY is currently down trending on the Weekly chart below, with fanning moving averages (MAs) and a bearish Weekly candle inside the MA sell zone that points toward bearish momentum. This week’s price action has broken down through the low of last week, which can be a good indication that the selling pressure remains.

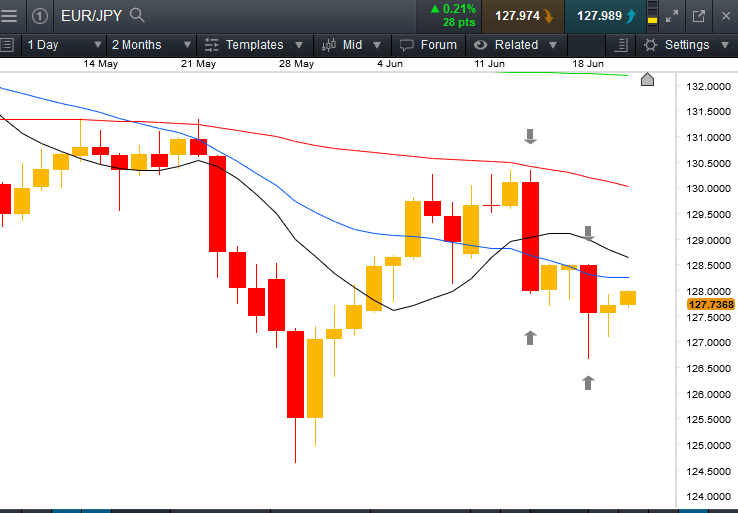
EUR/JPY has resumed its downtrend on the Daily chart, with a lower high and lower low forming.

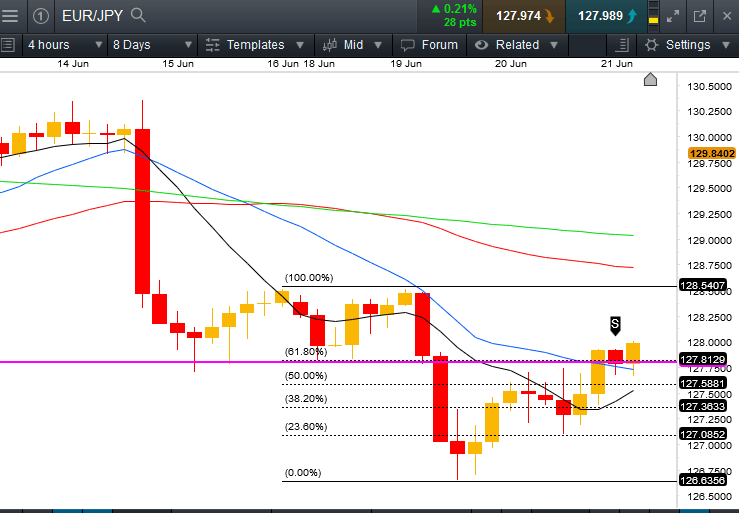
And as we continue down the timeframes to the Four-hour chart, the technical factors are beginning to stack up around the 128.00 level. First, the trend on the Four-hour chart has begun with price breaking through the low of a consolidation (marked in magenta in the chart below at 127.801).
Second, the MAs on the Four-hour chart are now aligned with price below the 10, the 10 below the 20, the 20 below the 50 and the 50 below the 200MA, which suggests selling momentum has been in place long enough for this bearish pattern to form. Third, price is re-testing the bottom of the consolidation now, which could potentially act as a strong resistance level. Fourth, price is already back into the MA sell zone on the Four-hour chart, reaching an equilibrium area indicating that price may turn south again from here.
And last but not least, the 61.8 percent Fibonacci retracement is also clustered around 128.00.

All these technical factors suggest that if EUR/JPY is likely to turn down, this level is good place to stalk for a short entry. If price rejects 128.00 and forms a small bearish candle, then a Four-hour trend flow short trade may set up.
I would eye a potential first target around 126.65, the low from two days ago. The second target would be around 124.62, the low formed on the daily chart on 19 June 2018.
Analysing the charts with a checklist of entry criteria, combined with careful monitoring of sentiment reflected in global media coverage on the US-China dispute, has enabled me to formulate a potential trade plan for my watchlist. I hope today’s blog gives you an insight into how I approach the markets. I choose to combine fundamental and technical tools to give me an edge in my trading.


