By Adam Harris, Trade With Precision
Trading commodities are a favourite of mine because they can trend for extended periods. And precious metals have been producing some encouraging movement. Gold has demonstrated a healthy trend recently, but it hasn’t been the only metal showing movement.
Palladium has seen growth over the past few months and shows little sign of stopping. As a result, both Gold and Palladium have shot up my list of preferred trending commodities and I am stalking them both for entry opportunities.
Gold
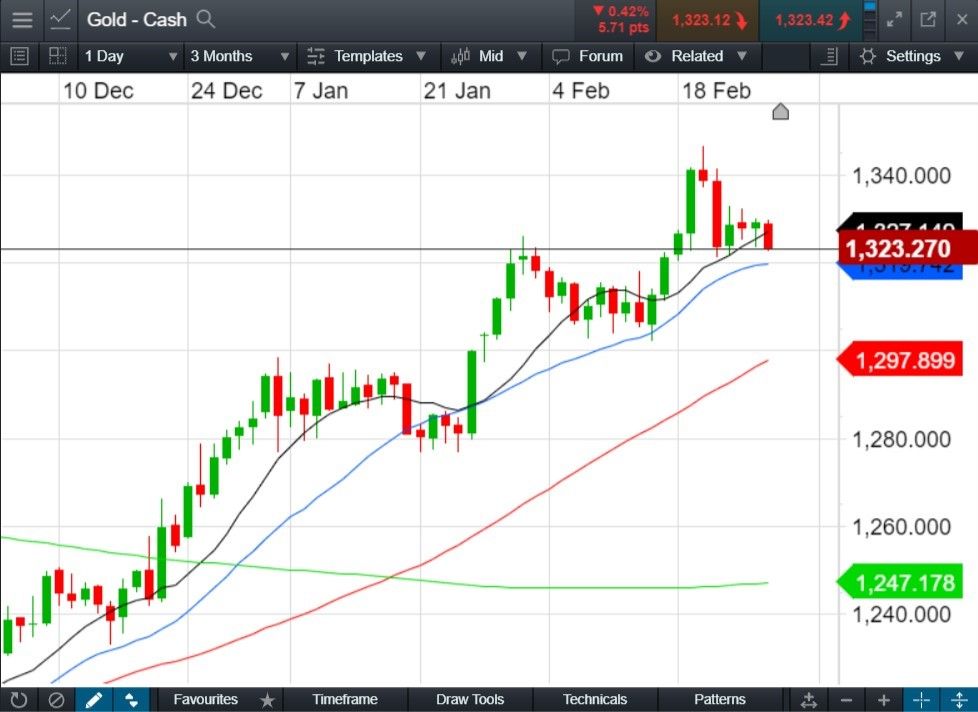
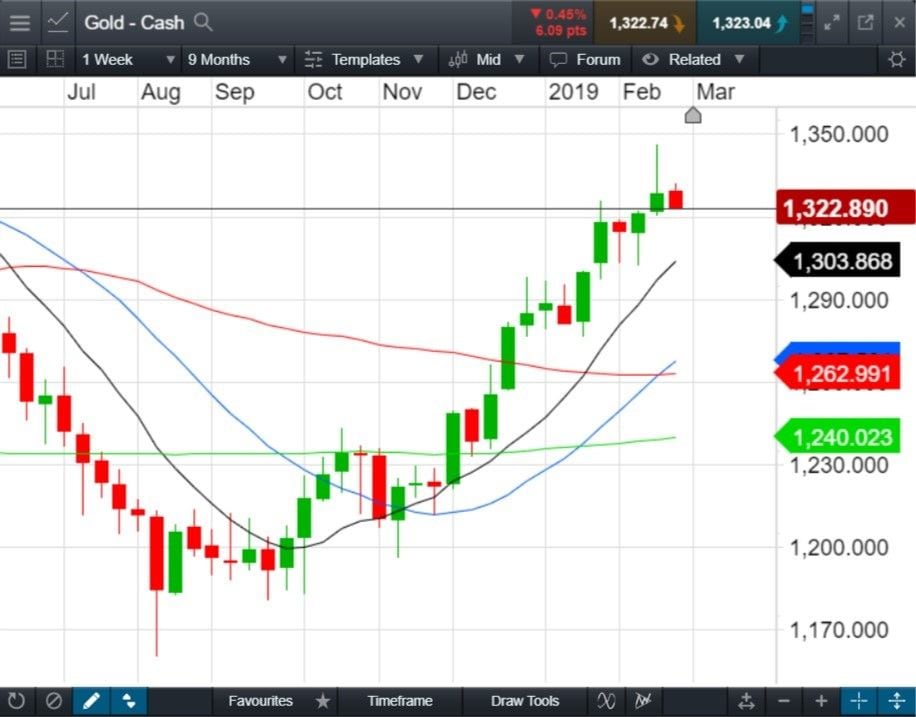
The daily chart below is clean, simple and shows a clear trend in place. Price currently might stay where it is, or possibly retrace to a slightly lower level on the weekly chart. On the daily however, the moving averages (MAs) are in the correct order, confirming that the longer and medium-term average of price is also trending upwards.
In my final gold chart below, which again looks at the daily time frame, I have highlighted two key areas where I will be waiting for Gold to find renewed support. One is where it is sitting now, and I have identified another area lower down it could retrace to in the medium term.
I’m looking at key historical levels, as well as Fibonacci support areas. I believe that the 1,350-1,365 area could offer significant resistance in the future, but for now, I’m happy to stalk long entries whilst price remains well enough below this potential ceiling.
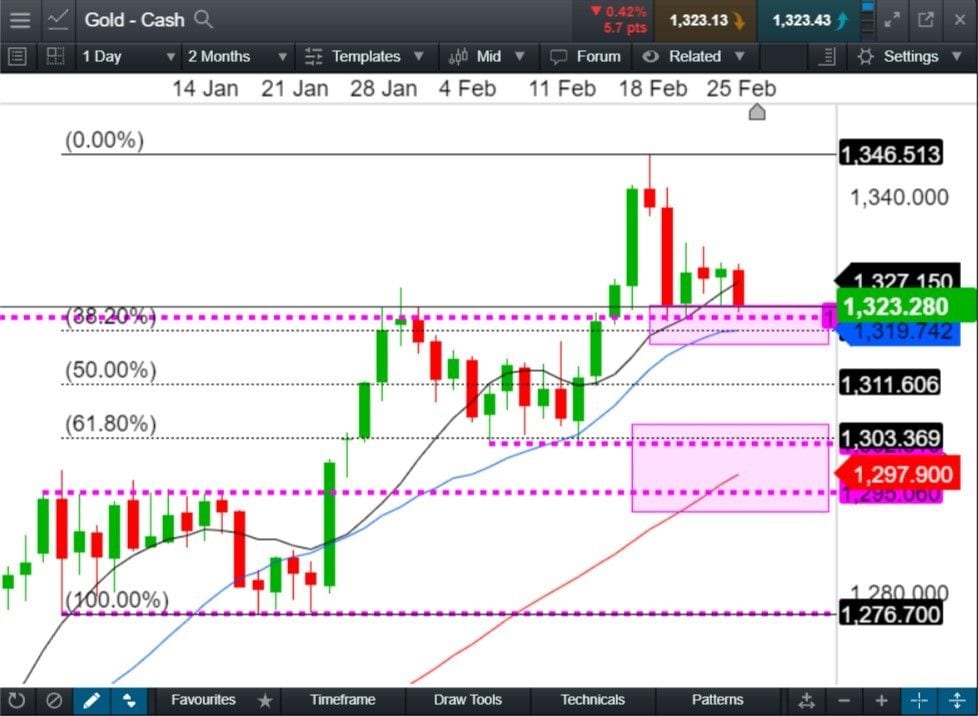
I’ll be waiting for a strong bullish candle at close to 1,320 now, or upon a deeper retracement, in the 1,300-1,295 area.
Palladium
I’m stalking the Palladium daily time frame for a swing entry long, with a broadly similar approach to Gold above.
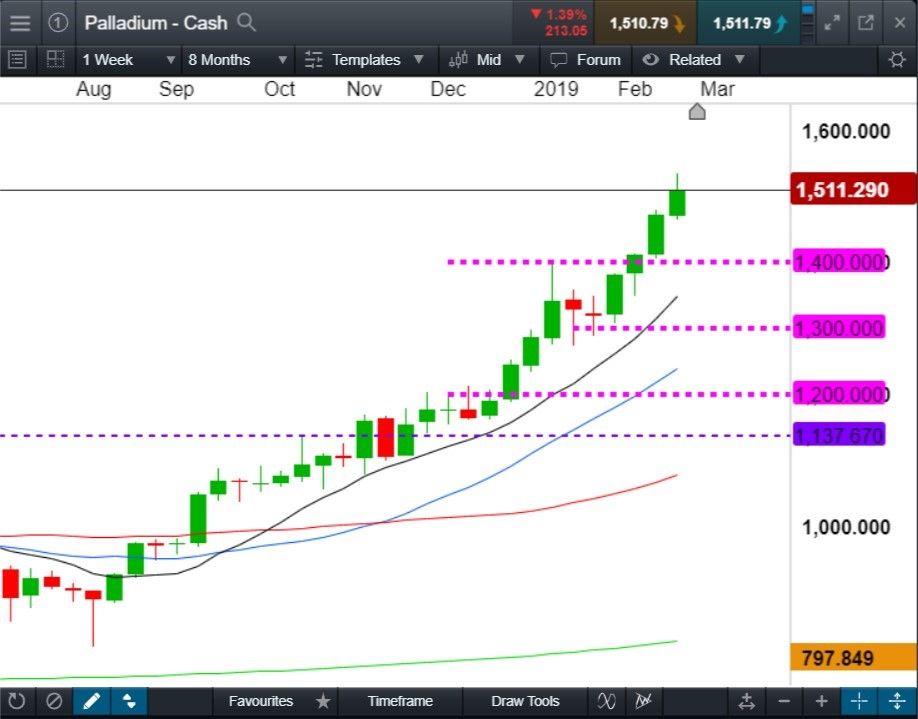
The daily chart has a clean.It is smooth and steady with minimal or no spikes and gaps. It’s a little over-extended and is in the process of producing a swing-high, implying that it could intend to retrace back down towards the MAs and/or a point of equilibrium.
What’s interesting here is that this instrument is experiencing fresh and previously unseen highs and offers little in the way of historical levels where entries are more likely.
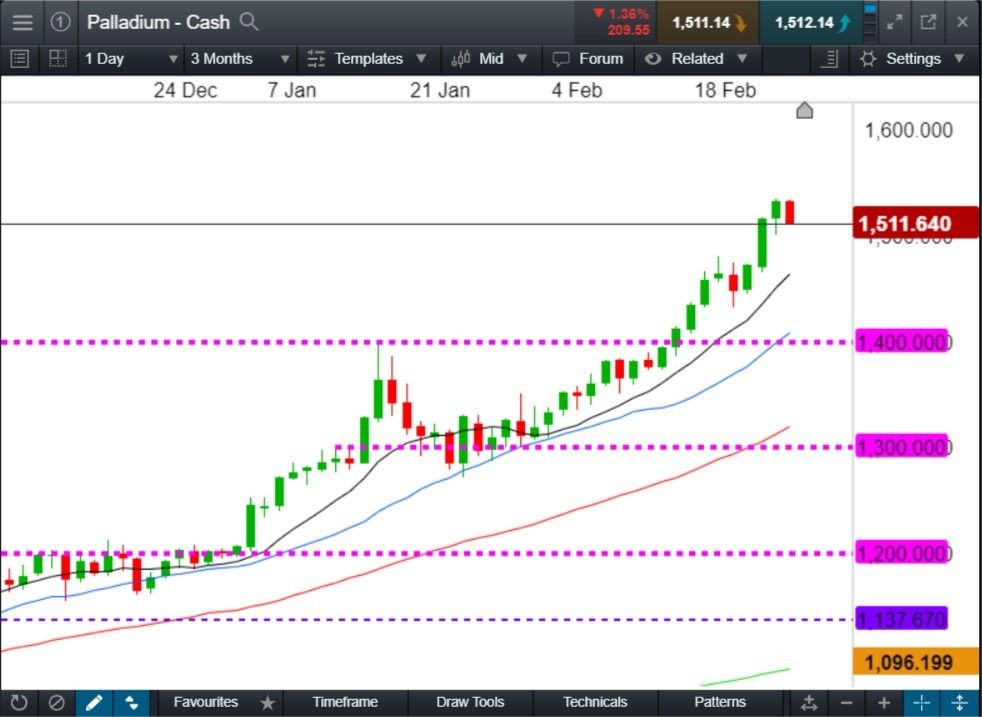
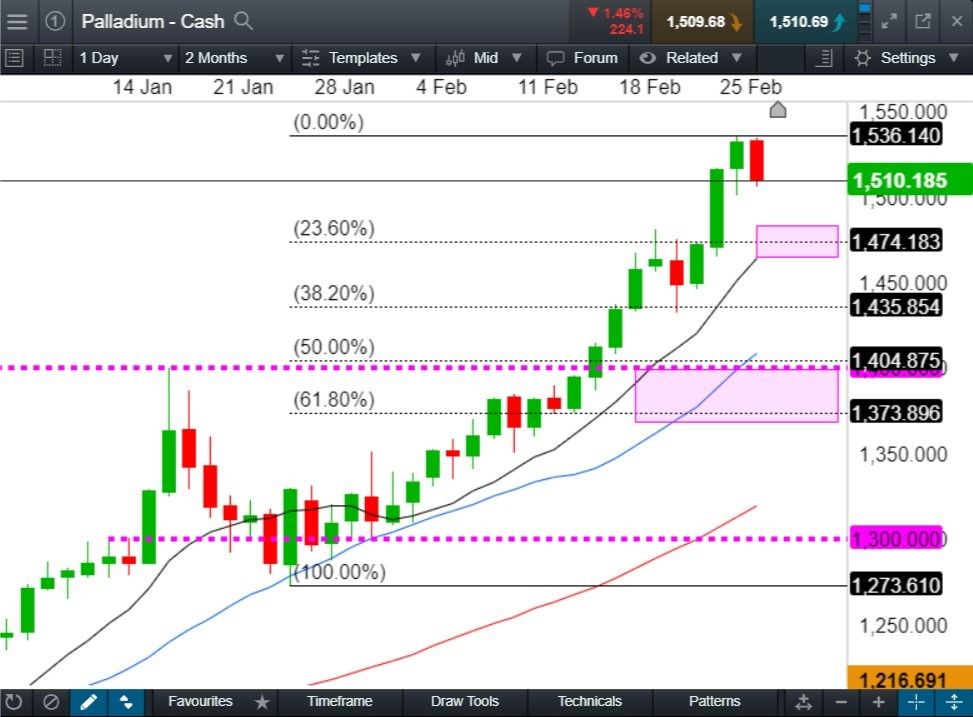
On the daily timeframe below, I’ve highlighted two areas where I will be patiently waiting for entries. I will wait and see if price pulls back to produce a bullish candle closer to the buy-zone (the area between the 10 and 20 MA) around 1,475, which is also a 23.6 percent Fib level, and the previous high.
Should the weekly fail to do that and retrace towards the 50 percent Fibonacci area, which is also at 1,400, and another previous high, this would let some steam off for the weekly chart’s overbought price and still be a strong contender for a daily entry.
I’d would also favour a strong bullish candle here, with my entry just above the high, and stop-loss just below, which could potentially benefit from protection by the 1,400 level.
What I like about these two precious metals is the strong and clear momentum. By contrast, many currency charts at the time of writing were either consolidating or trading in a range.
Happy trading.
