By Adam Harris, Trade With Precision
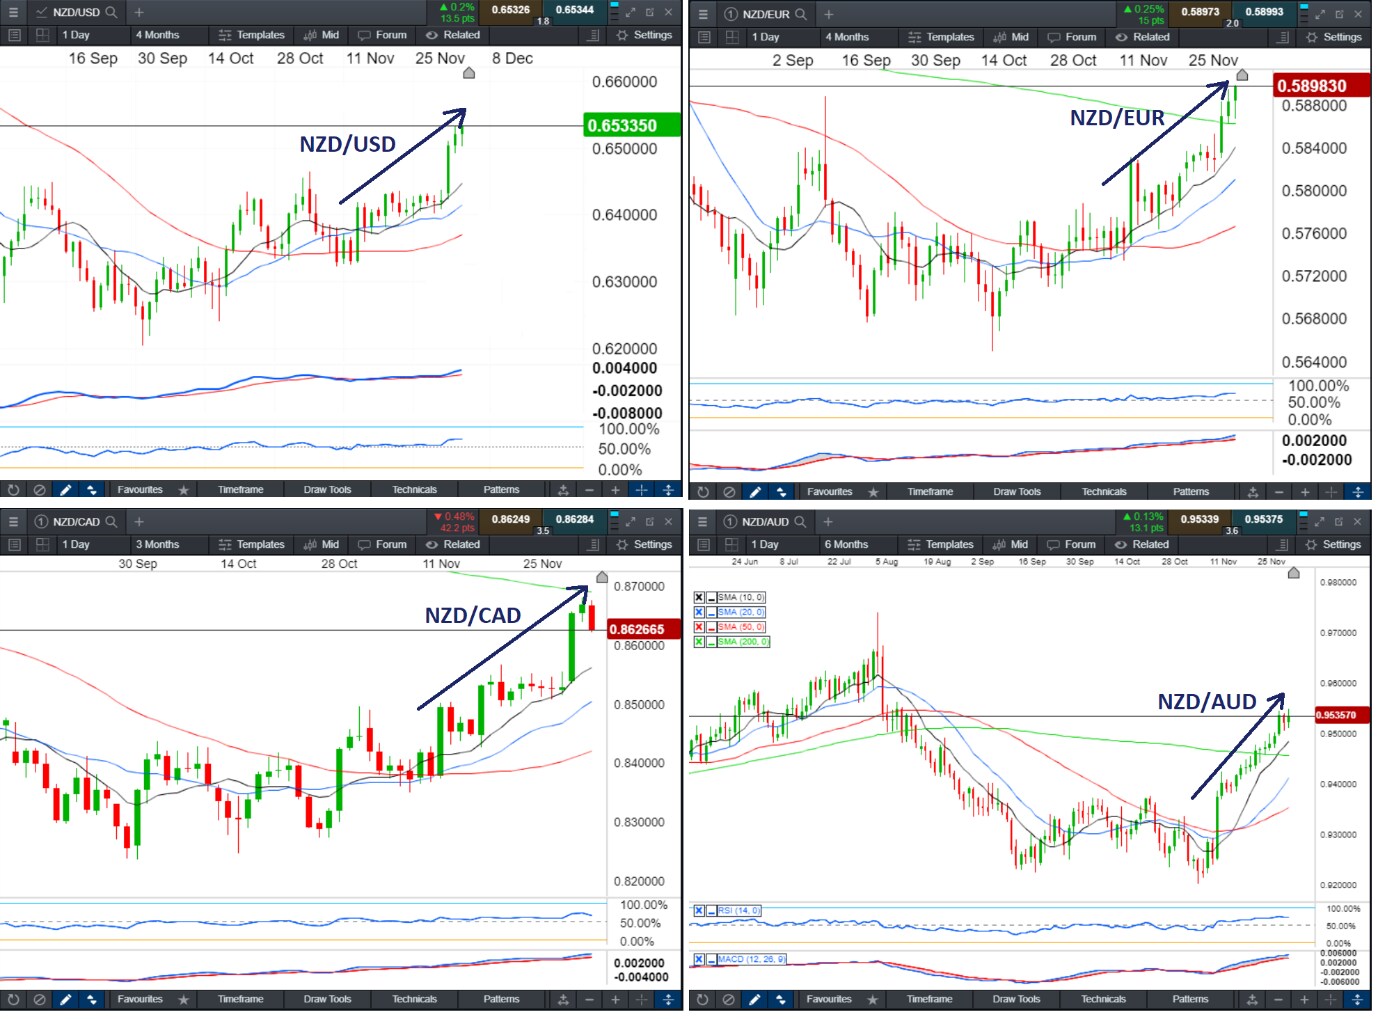
As I write this, many of the global indices are making a long overdue correction on the weekly timeframes. While I wait for them to reach a price area of support, I have taken an interest in the recent strength across most - if not all - of the NZD pairs.
The NZD has been weakening for the majority of 2019, and arguably since late 2017.
I’m keeping in mind that some of the NZD charts are still in a retracement phase of their monthly downtrends. But many have still got some way to go before encountering potentially strong resistance, which means that profitable opportunities may still exist on the daily and lower timeframes.
Below are four charts with the NZD listed as the base currency to illustrate the current strength it is showing against its trading partners.

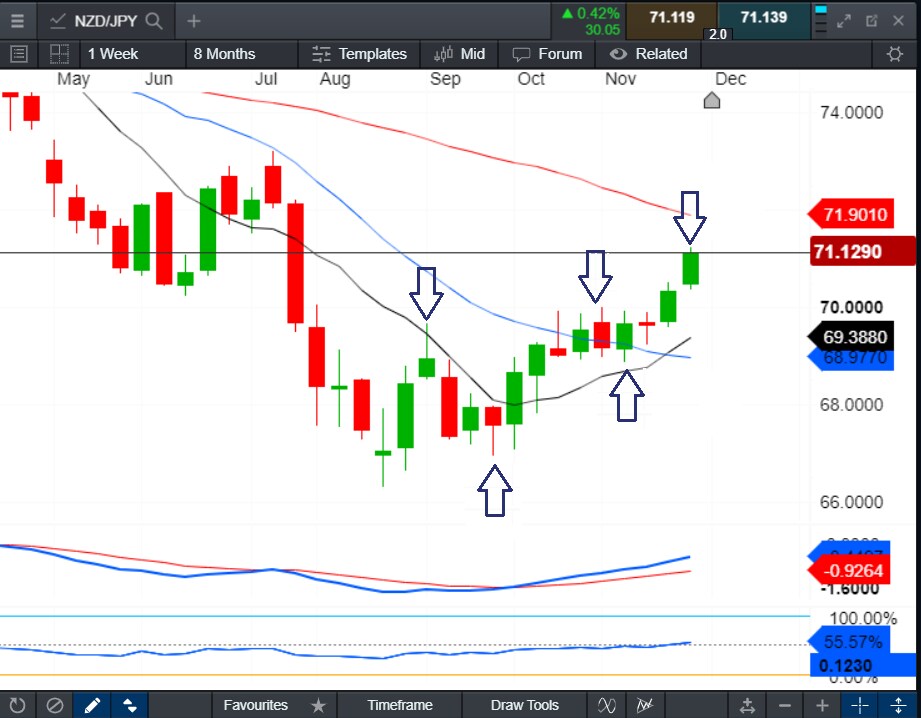
NZD/JPY is the market I am going to look at more closely. The Weekly timeframe below shows price has begun to trend up as it has started to make higher-highs and higher-lows as indicated.
Price is not too over-extended from the 10 & 20 moving averages (MAs) and has just broken above the 70.00 level.
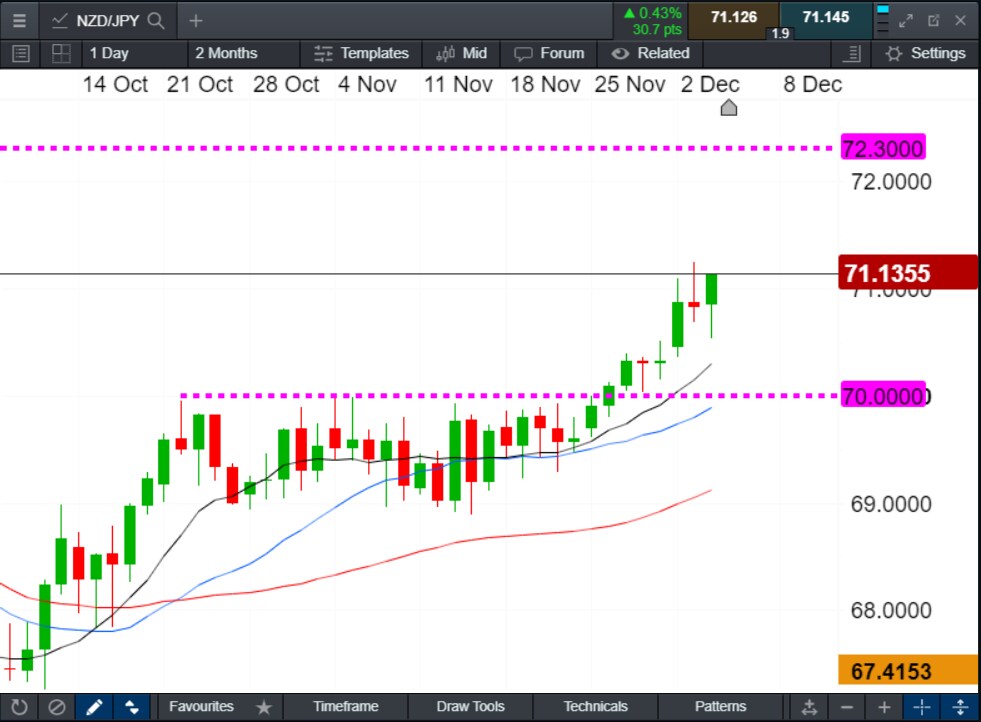
The momentum indicators show bullish momentum, indicating the trend is healthy.The daily chart also shows an uptrend with higher-highs and higher-lows and has recently broken through the resistance level at 70.00, which now has the potential to offer support, should price retest it. The momentum indicators also support the uptrend.

The daily chart also shows an uptrend with higher-highs and higher-lows and has recently broken through the resistance level at 70.00, which now has the potential to offer support, should price retest it. The momentum indicators also support the uptrend.

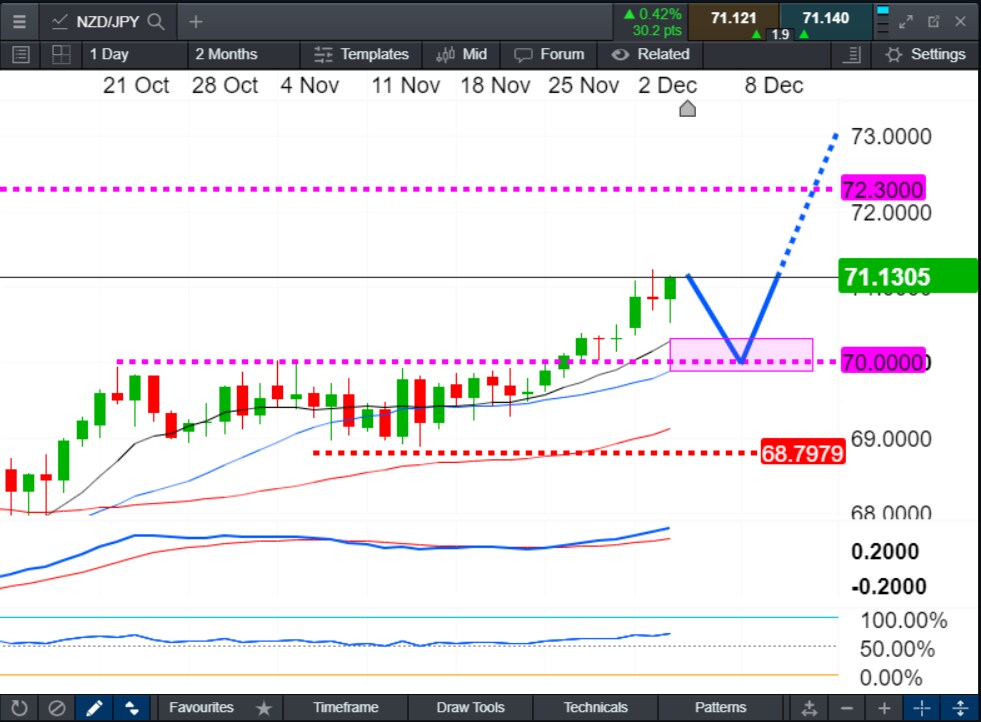
Finally, looking in more detail at the daily, I’m waiting for price to retrace back towards the buy zone area between the 10 & 20 MAs. Ideally, this would also overlap with the suggested support of the 70.00 level. I will keep an eye out for bullish candlesticks to form near this level as my possible entry into the next extension upwards.

I have the option of placing my stop-loss either below the bullish candlestick, or else below the recent swing lows and next soft support levels closer to 68.79.
Price has an upwards potential move up to the old weekly support level of 72.30, but I will aim to take profit should the trade move in my favour so as to get my trade to break-even as quickly as possible, and to reduce my risk. I also consider it possible that price could stall or turn just below the level of 72.30, and so will be prepared to exit my position(s) ahead of that level.
It may help me to watch out for any high-impact news on USD, JPY or NZD that could disrupt the trend- my main concerns would be US Non-Farm Payrolls, or any interest rate news.
Happy Trading!


