May you live in exciting times
By Adam Harris, Trade With Precision
(8 November, 2018)
A favourite Chinese fortune cookie saying is “May you live in exciting times”, alluding to a curse in which life is constantly in upheaval.
It remains unproven whether or not the exact saying ever originated in Chinese culture. But financial markets traders often feel as if they are living in interesting times. We’ve just finished the US mid-term elections, which resulted in what appears to be a further division in American political life with the Republicans holding the Senate, but losing the House of Representatives to the Democrats. The markets are also still digesting the impact of the trade wars, and uncertainty over the final shape of Brexit is continuing.
However, as a trader, I continue to follow various markets with a focus only on those charts that are trending, choosing not to distract myself with the noise that can often fill the newsfeeds.
GBP/AUD
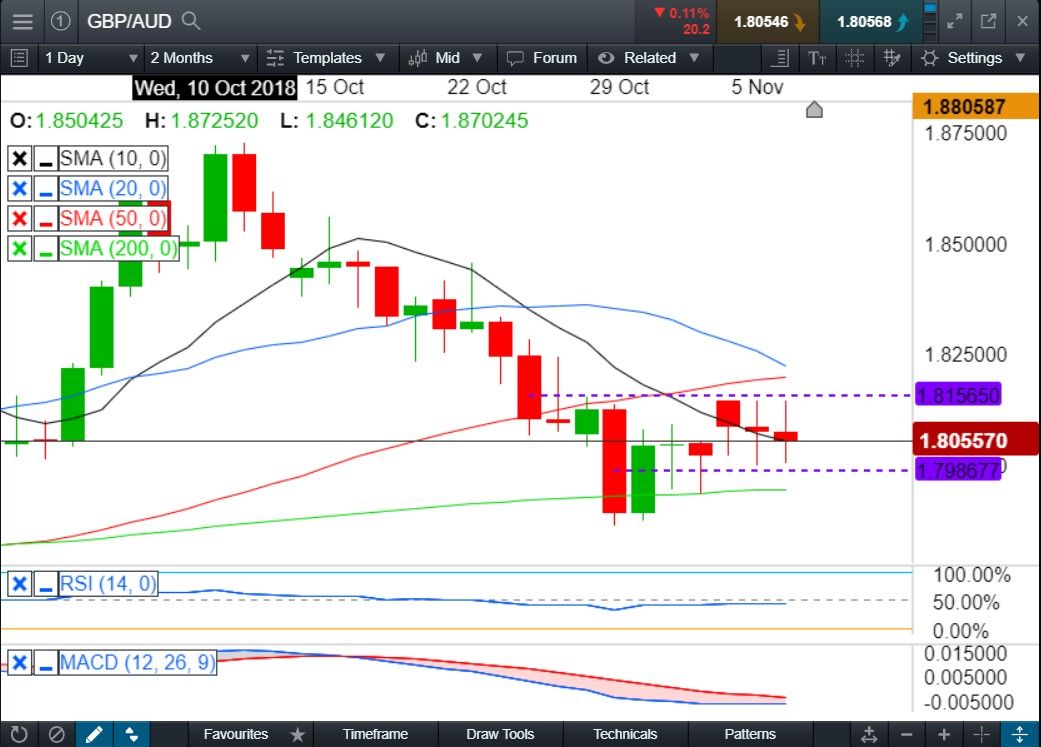
I’m stalking the daily chart of this currency pair and waiting for price to break below the 1.8000 level, specifically 1.7986, and the previous candles. I plan to place my stop-loss above the turning point of this possible swing-high, above the level of 1.8156

My usual approach to risk management is to try to get my trades to break-even as quickly as possible, and to achieve this I tend to split my one percent account risk into two separate 0.5 percent orders. Both will start with the same entry price and the same stop-loss, but the first order would have a 1:1 take-profit order. For example, if my stop-loss is placed 25 pips from my entry, then the take-profit level for this first order would be set at 25 pips from the entry in the direction of the anticipated market momentum or trade. Then I usually trail my second order’s stop-loss manually behind each previous day’s low/high, depending on the direction of the trade.
With GBP/AUD, if the market should break up through the level of my stop-loss before breaking the low of my entry, I will reassess the trade opportunity since this is now no longer the turning point of the wing-high. This would usually indicate to me that the trade opportunity had been invalidated.
This chart appears to be in a down-trend with lower-highs and lower-lows and has now retraced back into the moving averages (MAs) and Sell Zone, where bearish candles have been forming in a consolidation.
Lumber
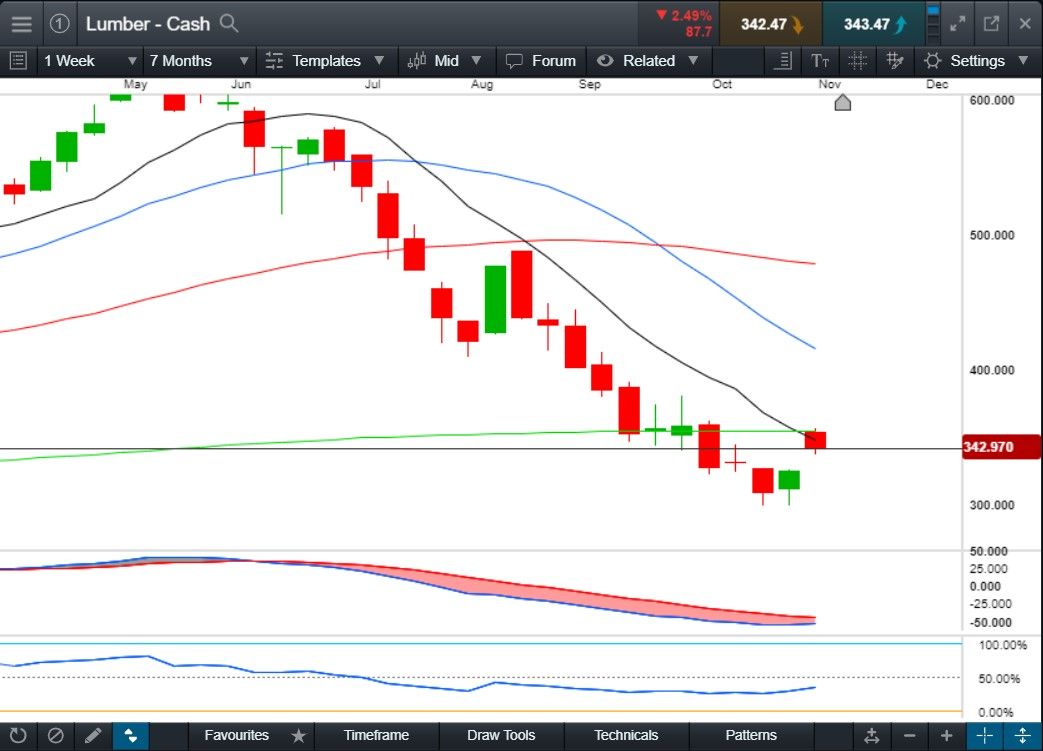
I’m also watching Lumber on the Weekly timeframe, where a smooth downtrend of lower-highs and lower-lows has formed. Price has now retraced back into the Sell Zone area of equilibrium between the 10 and 20 MAs and a small bearish candle is forming. I do need to wait until the close of the week to see if the candle closes as a bearish candle, or else the trade opportunity would be invalidated.

The order of the MAs is more established with the 50, 20, and 10 in a bearish formation. My plan is to enter at the start of the next candle, on the break of the low of this current candle, with my stop-loss above the high. In my opinion, this could be the turning point of this possible swing-high.
My account risk and trade management would be the same as for GBP/AUD above.
Heating Oil
Many of the Oils have been quite bearish the last few weeks, with moves to the downside. Heating Oil has captured my attention.
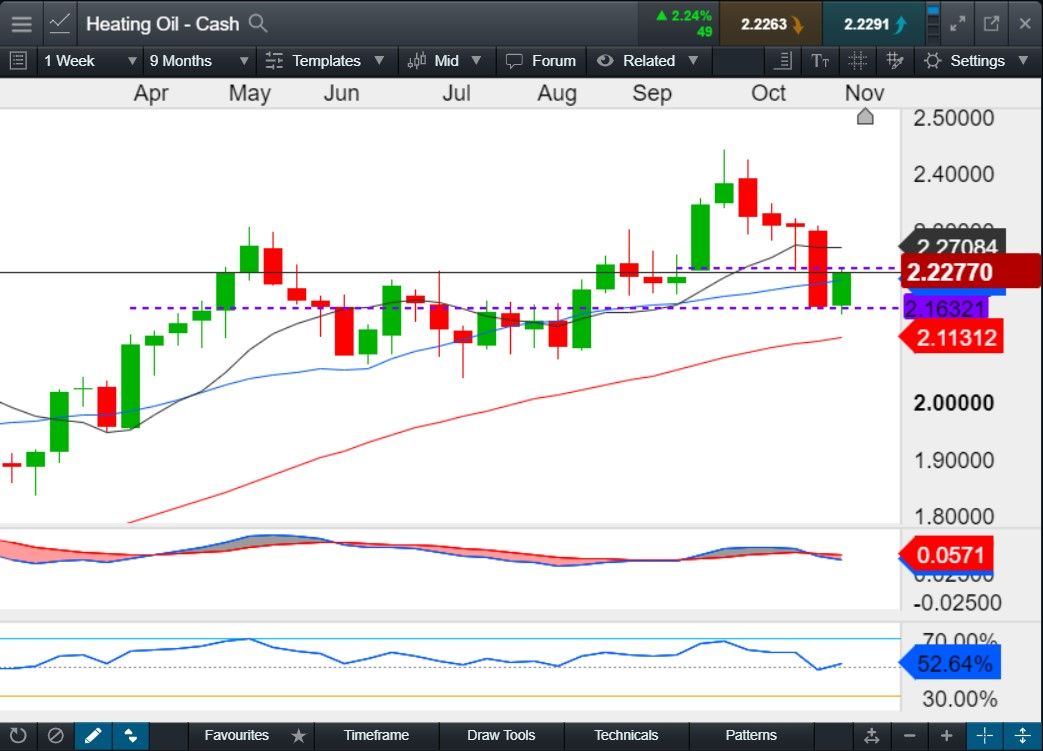
The weekly chart is generally in an uptrend. However, recently price action has retraced just far enough to breach the previous swing low, which in my experience could indicate that the uptrend is ending. In these cases, I keep in mind that this chart is now producing a bullish candle in the 10 and 20 MA Buy Zone and could be signalling an intention to return to an uptrend. If it closes in this bullish manner by the end of the week, and next week breaks the high of this week’s candle before breaking the low, this could be taken as a follow-through on the bullish candle’s intent.

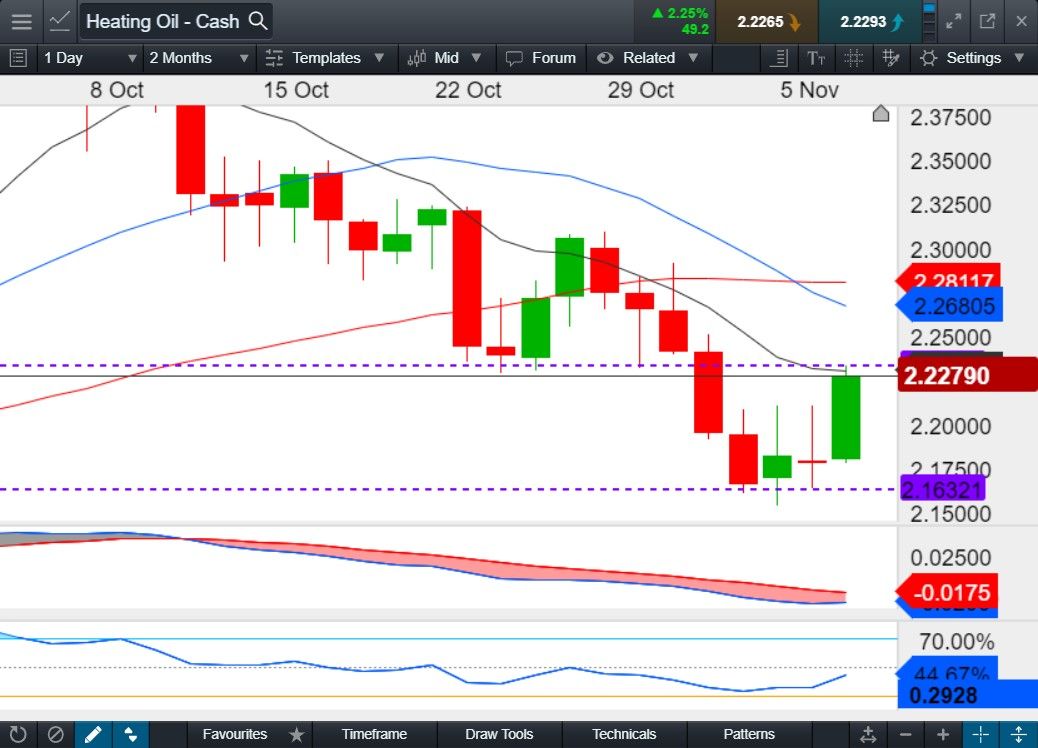
At the same time, if the low of this week’s candle is broken first, then the uptrend could be coming to an end and the daily timeframe supports this idea as it currently appears to be primed for a potential selling opportunity. Usually, I would be stalking the daily timeframe for a small bearish candle to form where price is now, in the MA Sell Zone, and against a support/resistance level of the previous swing-low lows.
However, because the weekly and daily charts have contradicting trends, my approach will be as follows. If the market ultimately intends to continue trending down, it may produce a bearish candle as expected on the daily, which I would then trade and manage in the same way as GBP/AUD and Lumber scenarios above.

Alternatively, should price action on the daily chart continue up and breach the previous swing high, this could potentially lead to the weekly candle closing more bullishly by the end of this week.
At that point, my trading plan would include the option to place a buy order above this week’s weekly candle should it break the high next week before breaking the low, with the idea of the weekly chart resuming its uptrend. I will also manage my two 0.5 percent orders around the weekly candle in the same fashion as discussed earlier in this article.
It’s going to be interesting to see how the markets respond over the coming weeks. The remaining key economic calendar news events scheduled for the year include items such as interest rate news and central bank policies. I will be especially interested in these outcomes as US economic indicators could have the potential to not stay the course established so far this year.
Happy trading.


