“It’s okay to panic, as long as you’re not the last to panic…..”
- Apocryphal
Professional traders know fear and greed. Panic is the active manifestation of fear, and affects markets as much as every other field of human endeavour. The saying above reflects the human nature of markets. Panicking early means preserving capital as markets fall, ready to grab bargains. Panicking late can mean selling at the bottom of the market. One of the keys to trading and investing success is panicking early, not often.
Pressure on share prices is growing. Fears of trade disruption and the negative impact of higher interest rates are fraying investor nerves Share market indices near multi-year and all-time highs are adding to the worries, as are stretched stock values. Is it time to bail out?
One of the reasons for investor optimism is a positive outlook for local and global economies. However the market is not the economy, and the economy is not the market. While they are clearly connected, the economy is happening now whereas markets price the future. This means a market sell down can occur even when the underpinning commercial activity is rudely robust.
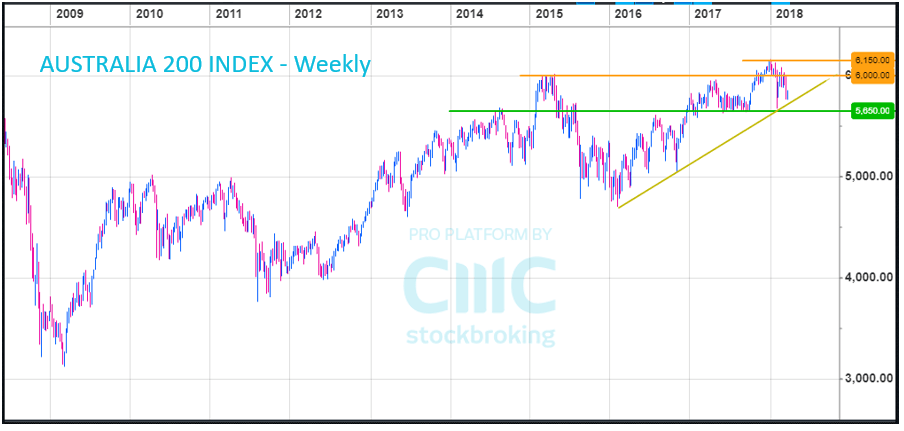
How do professionals decide when to panic? One school of thought relies on prices themselves as indicators of market thinking. The chart based analysis of trends, and price support and resistance, are attempts to discover the collective behaviour of the participants in a given market. The beauty of this approach is the market “tells” traders when to act. And the charts are pointing to a very important price point:

This weekly chart is the big picture. Relative to the past seven years share prices are elevated. There is a longer term uptrend (yellow line), and a defined trading range between 5,650 and 6,150. With the market sitting close to 5,800 the chart is mildly positive. There are a number of scenarios, including the possibility that the Australia 200 index will find a footing and rise to test the resistance at 6,000 and then 6,150 (orange lines).
However a market drop of just 3% would paint a negative picture. Not only would it breach the longer term support at 5,650, it would break the uptrend line. This sort of price action opens the door for an index pull back to levels closer to 5,000.
This demands attention from investors. A clear breach of 5,650 could be a read as a signal to panic, or at least reduce market exposures. And if the breach occurs its unlikely sellers at that level will be the last to panic.


