By Chloe Edwards, Trade With Precision
I continue to have a fundamental bias towards strengthening Gold prices, due to the ongoing economic impact of the Coronavirus crisis and resulting market uncertainty. This supports my technical view, so I am continuing to look for long opportunities in this precious metal commodity.
As always, I am keeping risk management at the forefront of my mind in these uncertain times, while continuing to look for opportunities to take advantage of the bullish trend.

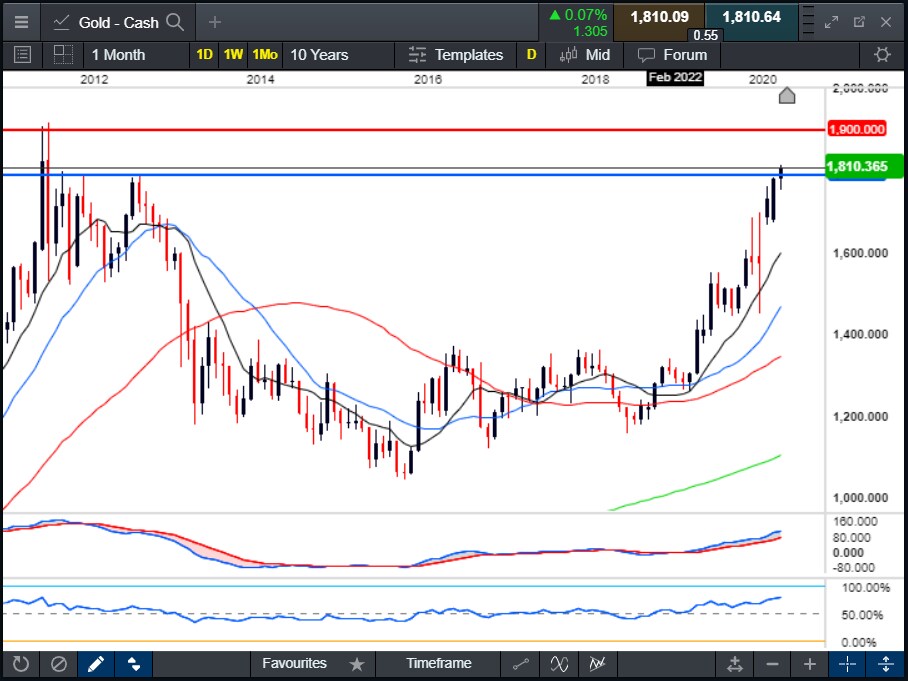
Looking at the monthly chart above, I can see that price has recently broken up through the key resistance area of $1,790, formed in 2012. I also note that the next potential resistance level above the current price could be at the next major round number level of $1,900, approaching the all-time highs set in 2011.

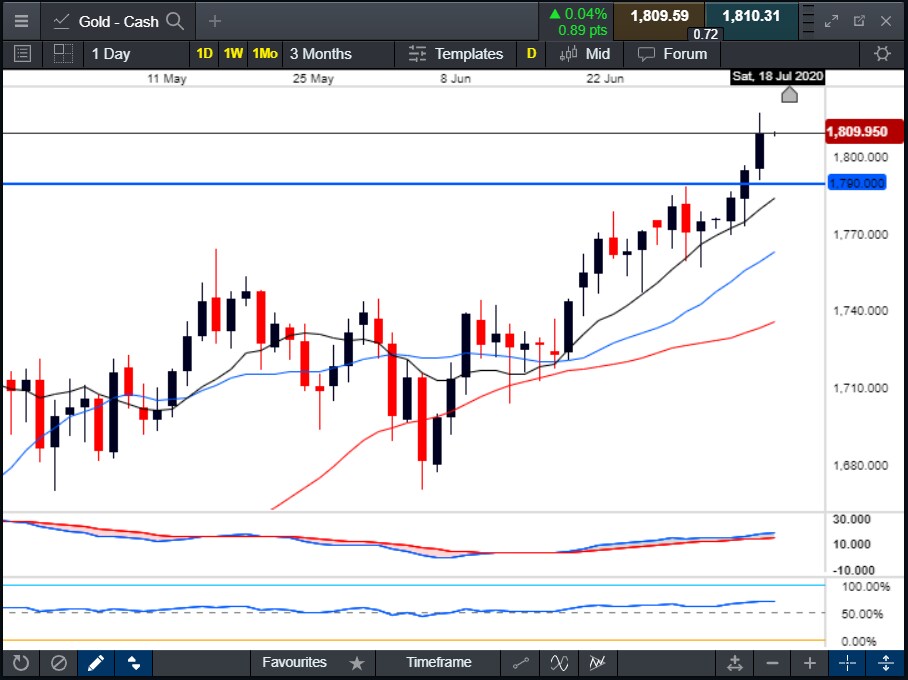
On the daily chart, I can see an uptrend in place, with price action forming higher highs and higher lows, and the 10, 20, 50 and 200 moving averages (MAs) – with the 200MA being just off the bottom of the chart here - lined up in the correct order, pointing upwards and fanning out, showing good bullish geometry.
Both the MACD and the RSI indicators are trending higher in a bullish fashion, showing convergence with price, which could confirm the trend momentum to the upside. The combination of this price action and the indicators suggests to me the potential for possible long swing trading opportunities, so I am currently looking for a pullback into the area around the 10 and 20 MAs on this timeframe.
Ideally, I would also like to see confluence between this area and the $1,790 resistance level, which could potentially become support now that price has breached above. I will then look for a small bullish candle to form around this area, and if this happens, I will use this as the basis for a long entry. If I await this pullback, it looks likely that there could be a decent reward to risk potential for the trade, up to the aforementioned $1,900 level.

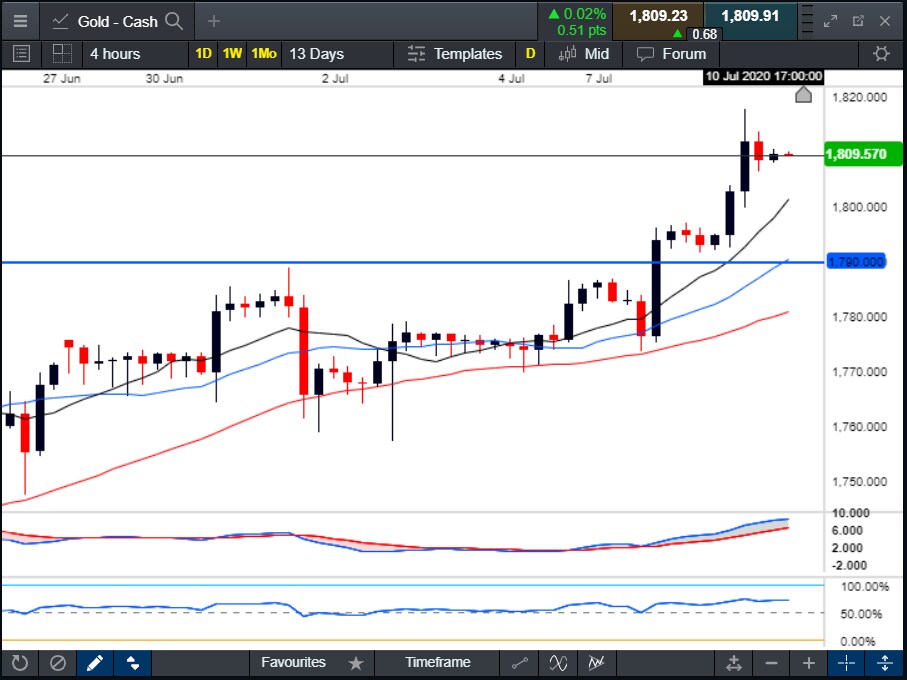
I am also looking at lower timeframes in order to gain a potentially even better reward to risk trade, and/or build on the swing trading position. On the four-hourly timeframe above, I notice the same bullish geometry of the MAs, along with higher highs and higher lows in price action, and strong bullish convergence of the RSI and MACD momentum indicators.
I will be awaiting a pullback into the buy zone around the 10 and 20 MAs and looking for a small bullish candle to print in this area. If this happens, I will be using this candle to place my entry and stop loss, still with the same ultimate target of $1,900.
Stay safe and healthy, and happy trading.


