By Adam Harris
The global sentiment on the index markets appears rather uncertain at present. The currencies aren’t quite ripe with any immediate opportunities according to my trading strategies either. But it’s good to know I can always count on at least a few commodities to provide me with some interesting trends.
Currently on my radar are two oil-based commodities that could provide me with entries within the next 1-2 days.
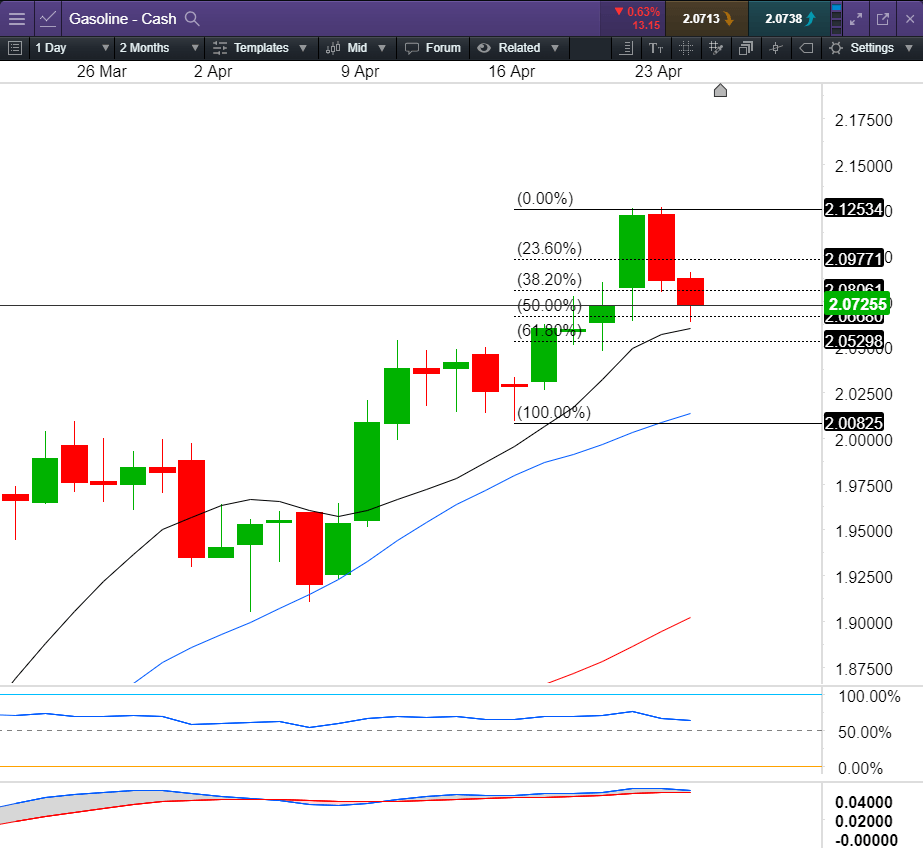
The first on my list is Gasoline on the Daily chart, which is currently retracing back into the buy-zone, the area in and around the 10 & 20 moving averages (MAs).
I like the look of the momentum indicators, which are currently not showing any signs of divergence, and we also have a Monthly and Weekly uptrend, which gives me trend confirmation.
In particular, price is now also approaching the 50 percent and 61.8 percent Fibonacci levels, as well as the 2.050 round number, which also includes a recent high.
I’m specifically looking for a small or small-medium sized bullish candle to form. Indeed, even a bullish rejection candle would suffice. My entry would then be above the high of this closed candle with my stop-loss below the low, given some additional protection provided by the elements just mentioned above.
There doesn’t appear to be any obstructions on the way up to the next Monthly level of 2.4450, providing the potential for some acceptable reward for my risk. I will likely split my orders up into two separate ones, the first having a 1:1 take profit target.
Next, let’s look at Brent Crude Oil, on the daily timeframe I find a similar opportunity and chart structure. Many of the aspects of the Gasoline chart are also present here:
- The Monthly and Weekly are in an uptrend,
- Price is retracing into the MA buy zone (the zone between the rising 10 and 20 MA),
- Price is pulling back to a 50 percent and 61.8 percent Fibonacci level
- Price is resting on a previous high.
- The momentum indicators do not show any divergence at this time.
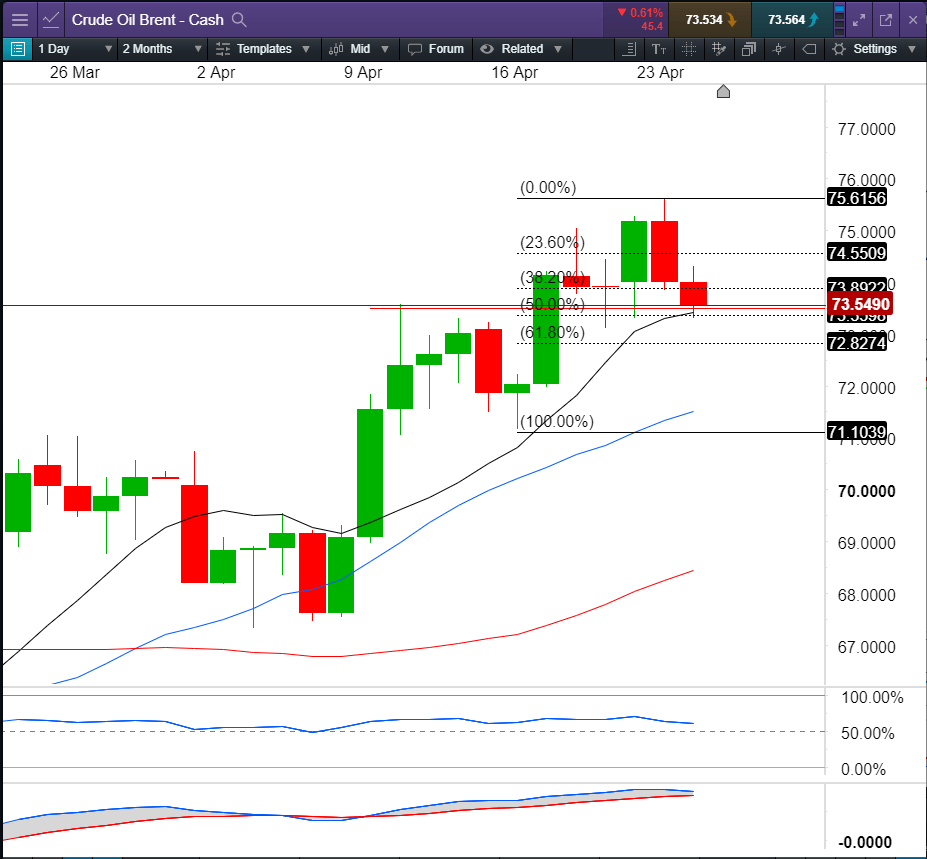
My approach will be identical - two orders, one with a take-profit target of 1:1, and the other with a 3:1 take profit target.
Initially my entry will be on the break of the high of a small/small-medium candle, with my stop-loss below the low of this candle. The next significant high on the monthly chart is effectively 88.00 and so this chart also offers me acceptable risk to reward.
Happy trading.
