USDJPY and other JPY currency cross-pairs have had a bullish run while the Japanese Yen has been falling in value throughout March, with the currency recently hitting an almost 7-year low against the U.S. Dollar. This is due in part to the differing monetary policy stances of the BoJ and U.S. Federal Reserve, as well as inflationary pressures, with Japan being a net importer of many key commodities. With these two factors remaining the same in the short term, there could be a fundamental, as well as technical, reason to continue looking for long opportunities in JPY cross-pairs.
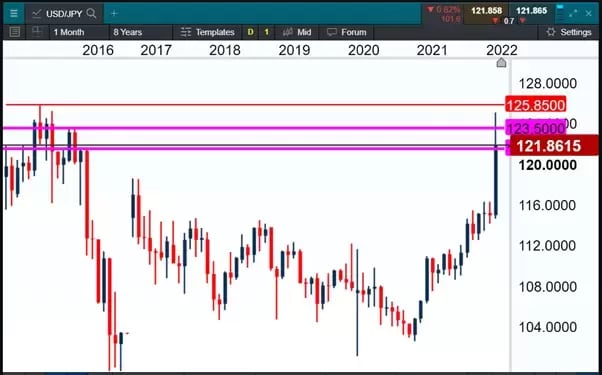
The monthly chart of USDJPY below shows price approaching the high from June 2015 at 125.85 (marked in red) along with two other significant levels of support/resistance (marked in pink), at around 123.50 and 121.50. With only one trading day of March left, a continued bullish outlook would be more probable if the month ends strongly above at least one of these support levels.

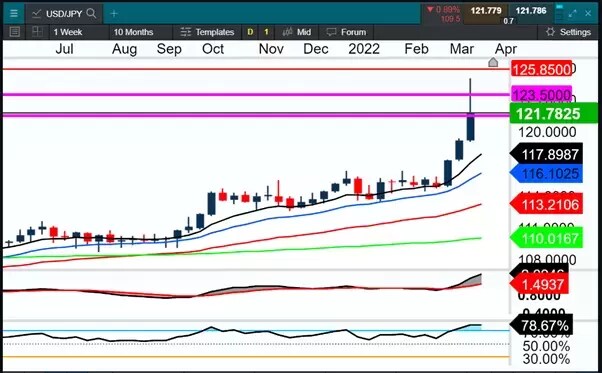
On the weekly chart below, an uptrend is established, with higher highs and higher lows in price action, and the 10, 20, 50 and 200 MAs lined up and showing good bullish geometry. The MACD and RSI indicators show bullish convergence with price, indicating the uptrend could still have some momentum behind it.

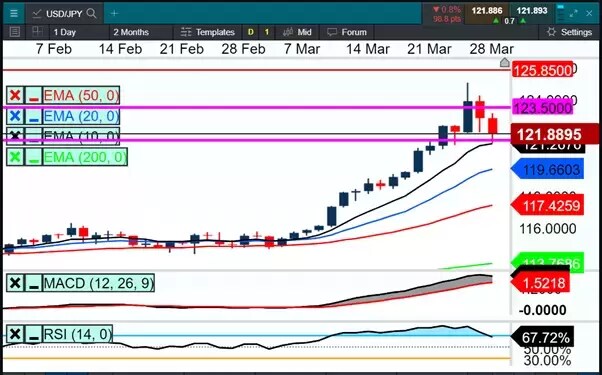
On the daily chart below, an uptrend in price action can also be seen, with successive higher highs and higher lows. The 10, 20, 50 and 200 MAs are lined up, pointing upwards and fanning out, in support of the established uptrend. The MACD and RSI indicators are converging bullishly with price, which could suggest the uptrend still has some momentum behind it. Price has started to pull back down towards the ‘buy zone’ – the area in and around the 10 and 20 MAs - and is also currently testing the horizontal level of support at 121.50. A bullish candle printing in this area could indicate the beginning of a further move up. If the 123.50 level breaks to the upside there could be more opportunities to buy on the horizon, on this timeframe and on lower timeframes such as the four-hourly, and it is possible that price could move up towards the next major level of resistance around 125.85 and even beyond if the uptrend continues.

An alternative view, should the 123.50 level prove too resilient, would be a move back down to support around 118.00.


