By Adam Harris, markets trader and contributor for Trade with Precision
As I treated myself to Taco Tuesday at Wahaca in London, I couldn’t help but notice the enthusiasm with which the UK is abandoning its meagre Summer this year. The country is eagerly embracing the cooler winds and darker shades of Winter- way too early for my liking. It really did cross my mind to wonder when I would have to switch the heating back on - and it feels like I only just switched it off a month or two ago.
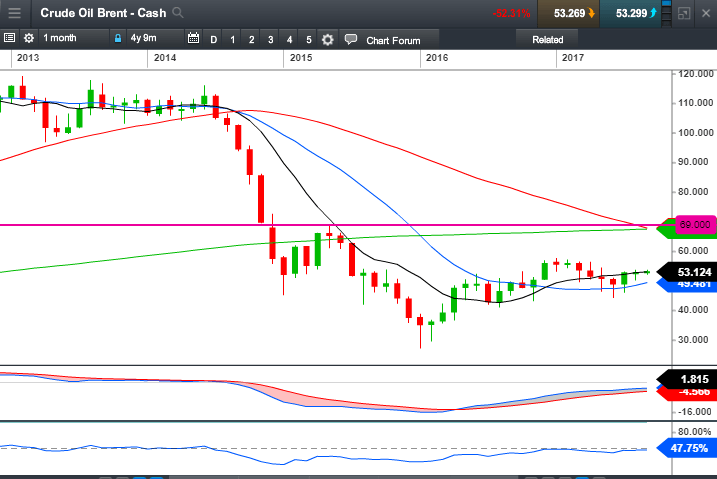
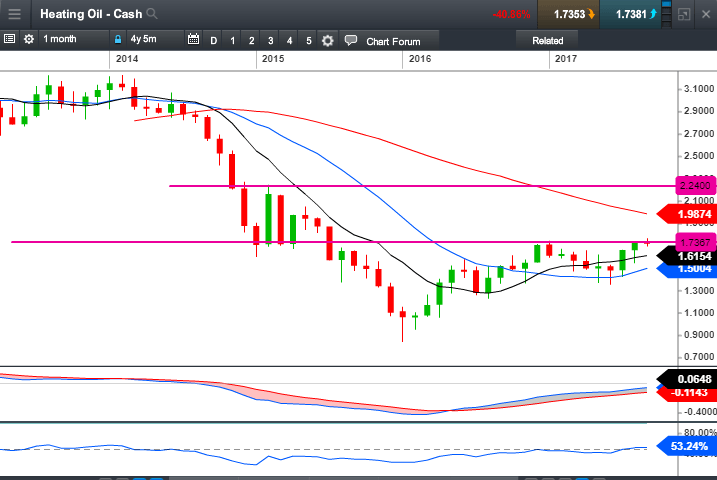
With wintry weather approaching the Northern Hemisphere, and possibly sooner than usual, it makes sense to see where the energy commodities are at. And it isn’t at all surprising to see them looking more bullish than they have in recent months.
This increase in demand for energy commodities from the countries in the colder climes could offer opportunity to traders everywhere, regardless of where they are based. The charts below have caught my attention, let’s assess them for potential trading opportunities that could set up over the coming days, or weeks.
Across each of these charts, I am principally bullish, and am really just looking for the best possible entry to go long. In some cases, I will need additional confirmation before anticipating an entry signal. And with some of the charts, it’s feasible that I could have more than one entry opportunity. All of this is based on my strategy. I’ll be looking for bullish candles, usually in the buy zone - the area around the 10 and 20 simple moving averages - combined with strong support levels, reinforced by Fibonacci levels, which are an added bonus.
For this analysis, I’ve focused on the Cash versions, starting off with Gasoline. The monthly chart below shows a solid uptrend, with price neatly retracing back towards the buy zone.
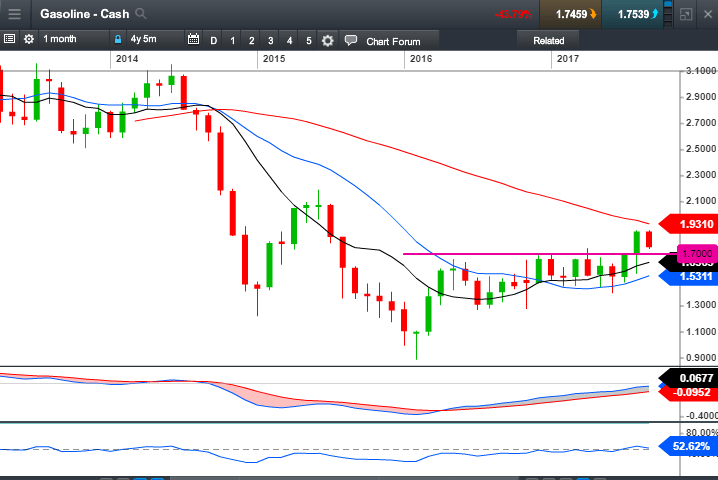
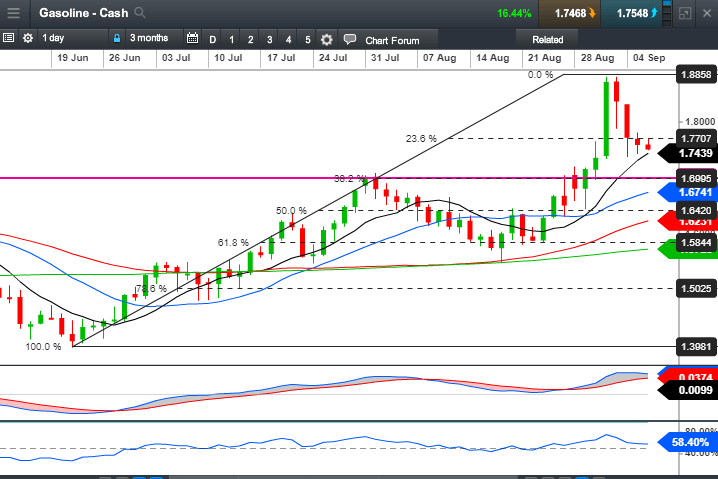
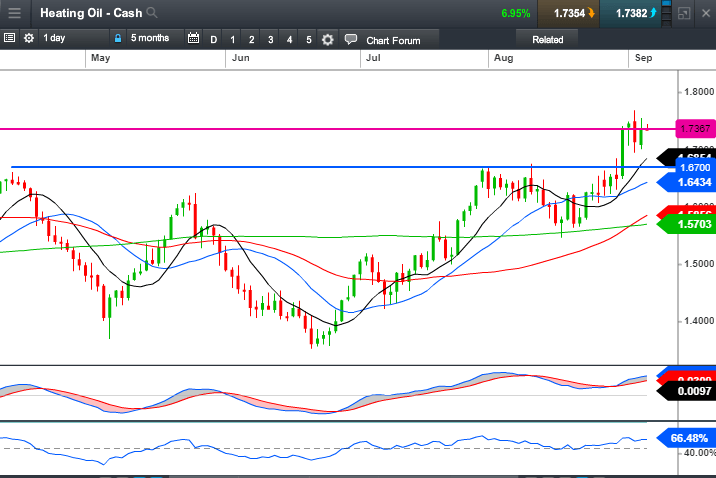
As an alternative, price may simply begin to bounce its way up from where it is now. My prerogative will always be to enter around the buy zone moving averages, and the most fair price range at this time still looks to be between 1.6700 and 1.700 as key levels, as well as the current occupation of the buy zone.
So, despite the bleak outlook from my terrace and gloomy weather reports, these bullish charts should be able to keep me warm over the coming weeks as winter breaks here in Europe.


