By Adam Harris, Trade With Precision
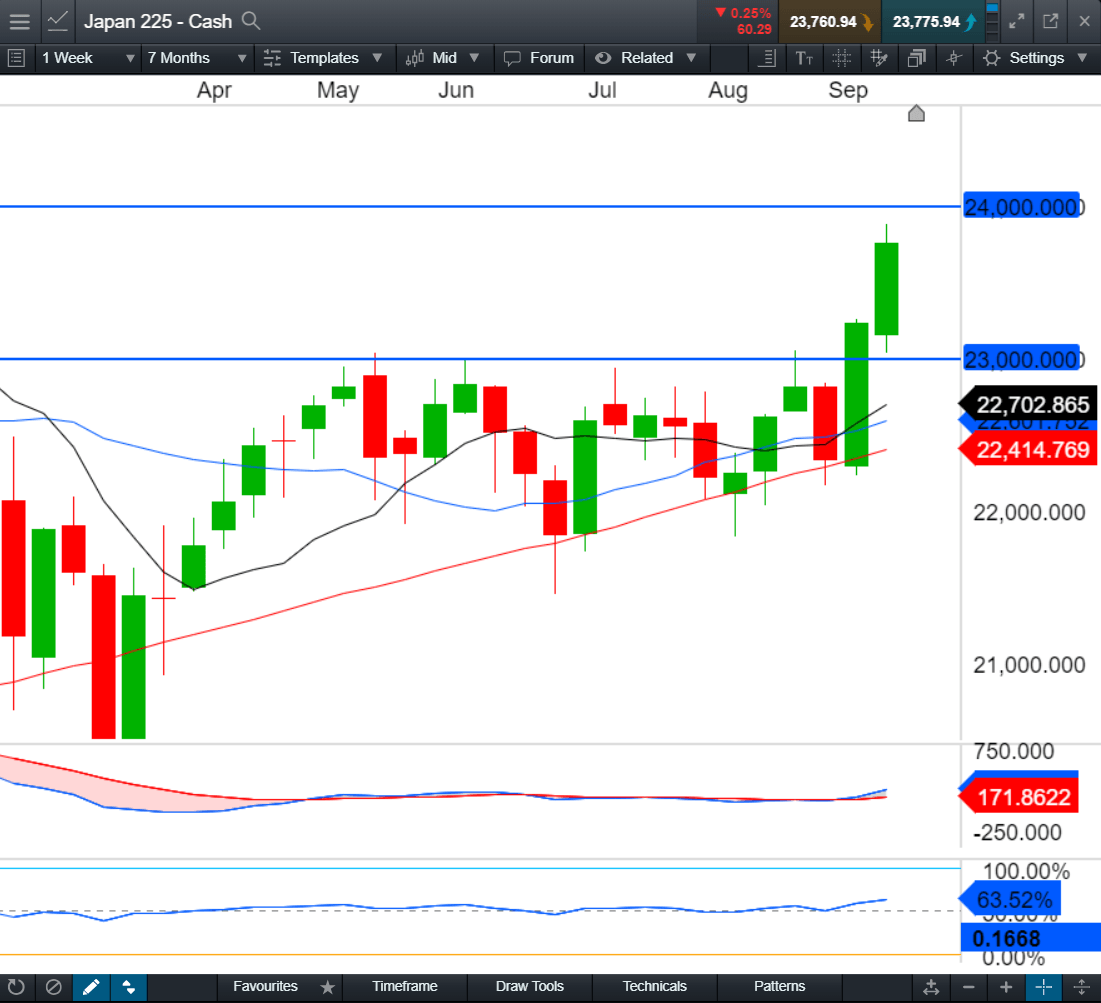
The continuing trade tensions driven largely by US President Donald Trump have been impacting the markets for most of the year. They may well end up being the basis for most of the market moves this year and, unusually, have impacted most asset classes. In this context, there have been changes in the correlation of indices in different parts of the world. For example, while the Hong Kong 50 has been notably bearish, the Japan 225 recently had a clearly bullish breakout from a consolidation lasting since the end of April this year.
Today I’m going to look at potential opportunities in the Japan index and Coffee.
Japan 225
Taking a look at the Weekly chart below, we are in an uptrend with higher-highs and higher lows, and with the moving average (MA) geometry in the correct bullish order and fanning out. We’re not too over-extended from the MAs and price appears to have comfortably broken through a recent level of resistance at the 23,000 price level.

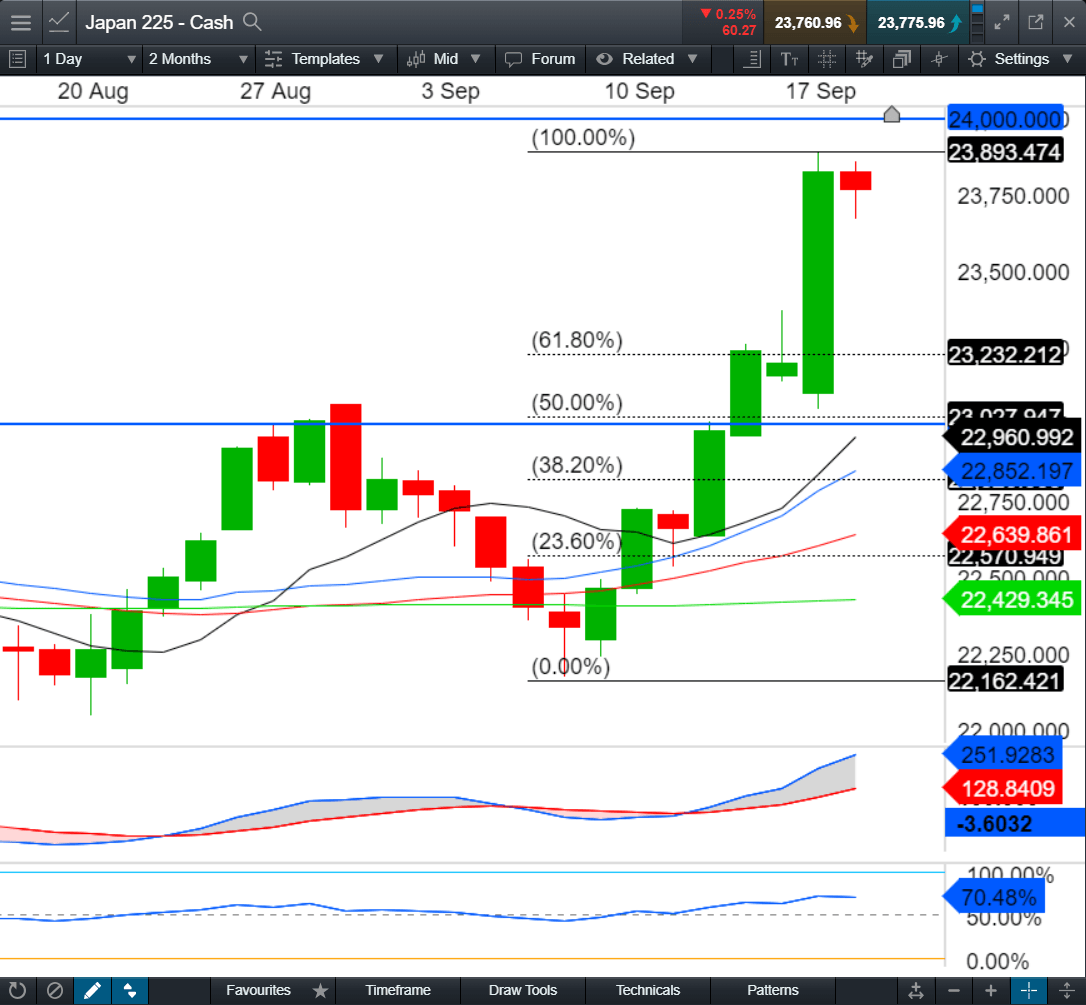
Taking a closer look at the Daily chart below, I particularly like the overlap of the 23,000 level with a 50 percent Fibonacci retracement level, as well as the 10 & 20 MA zone of equilibrium. Traders often look to combine evidence that could support the idea that price is more likely to go in the trader’s favour than against it. So far, we have:
A Weekly uptrend
A Daily uptrend
More stable price action
A historical level of Support/Resistance
A round number i.e. 23,000
A Fibonacci level of 50 percent
An area of equilibrium that historically is a higher probability zone for entering good trends.

I will be waiting for price to retrace down to this level in the coming days, and ideally form a small bullish candle just above this level. From a risk management standpoint, I will split my one percent of capital risk into two separate 0.5 percent orders, one with a 1:1 take profit target. If price does produce a small, or small-medium sized candle above this 23,000 level, I may take advantage of the additional potential technical protection that this level offers, by placing my stop-loss either below the low of this future candle, or alternatively below the recent daily swing-low.
The chart also appears to have another historical level at 24,000, and so I will be cautious about taking any profit ahead of this level, in case price has an adverse reaction when it reaches this possible resistance level.
Coffee Arabica
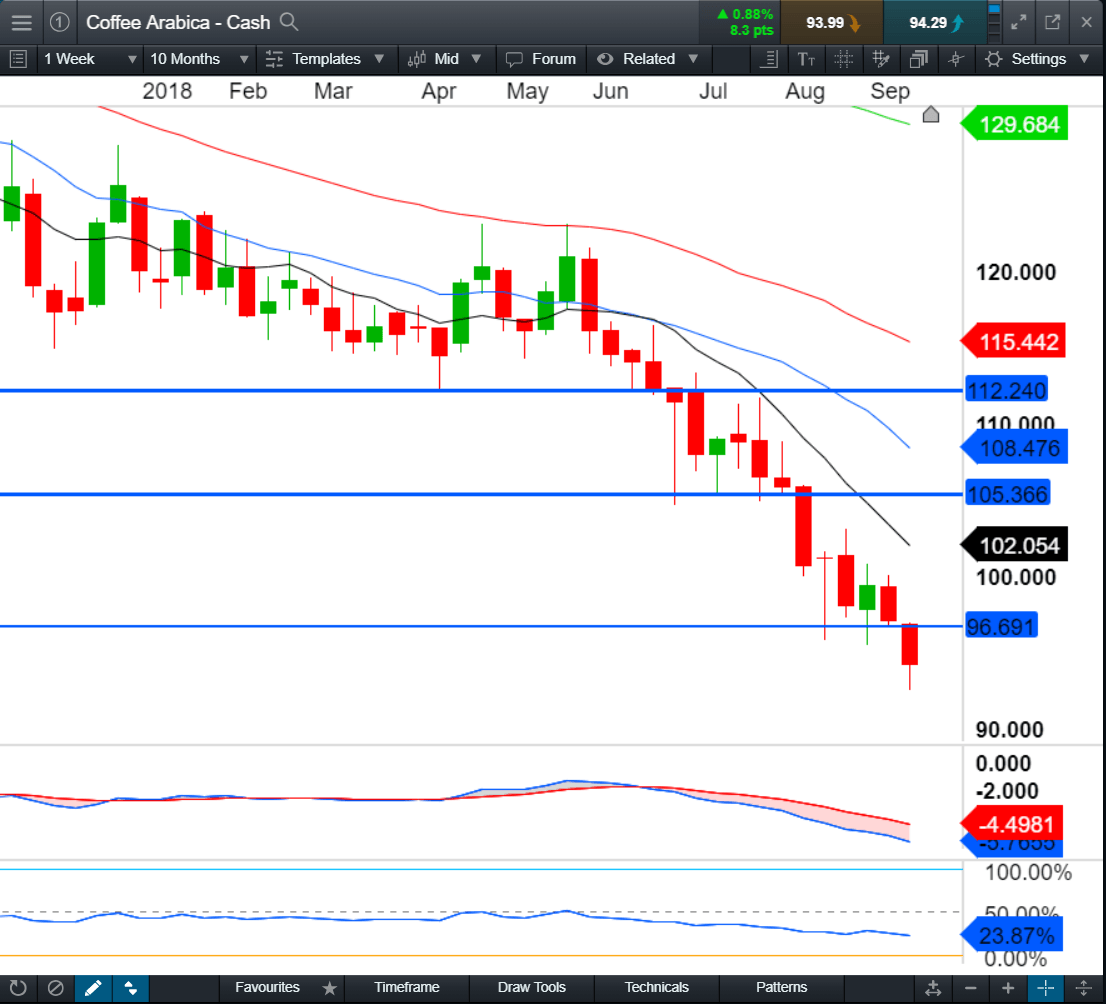
Commodities can have trends that last a long time. Coffee Arabica has been trending down for large parts of 2018. On the Weekly chart, price’s behaviour has been relatively steady and has been running down in parallel with its 10 & 20 MAs. The momentum indicators (MACD & RSI with default settings) are convergent which points to the fact that the trend appears to be healthy.

A second Fibonacci measurement from a prior swing-high produces yet another Fib level of 50 percent, which overlaps precisely on top of the 50 percent measurement from Fib 1 and the S/R level.
Price action is also close to the 10 & 20 MA Sell Zone on both the Daily and Weekly timeframes.
So far, in terms of evidence to support this potential trading opportunity, we have:
A Weekly downtrend
A Daily downtrend
More stable price action
A recent historical level of Support/Resistance
A Fibonacci key level of 50 percent, which overlaps with a second Fibonacci measurement’s 38.2 percent level
An area of equilibrium that historically is a higher probability zone for entering good trends.
Taking a similar approach to risk management, I intend to split my orders into two 0.5 percent orders, and take advantage of a small - or small-medium - candle in the Sell Zone, testing for resistance at this level, to place my stop-loss above a recent swing-high for both price action and additional potential technical protection on the other side of an S/R level.


