Since last week, the Chinese stock markets have soared from multi-year lows on Beijing’s pledge to stabilise the financial markets, signalling a further stimulus monetary policy might be on the way. According to Bloomberg, China stockpiled record high cash in the first two months of the year, indicating the country has its full capacity to turn things around by stimulating the economy.
The Hang Seng index rebounded 18% from a six-year low from a week ago, recovering half of its losses since the barometer index plunged from its February high. The Chinese e-commerce giant Alibaba has just announced to ramp up its share’s buyback programme to US$25 billion. The stock (9,988) jumped 4.3% in the Hong Kong stocks exchange at press time.
From the technical perspective, the Chinese stocks are still on the rise from a possible long-term bottom reversal.
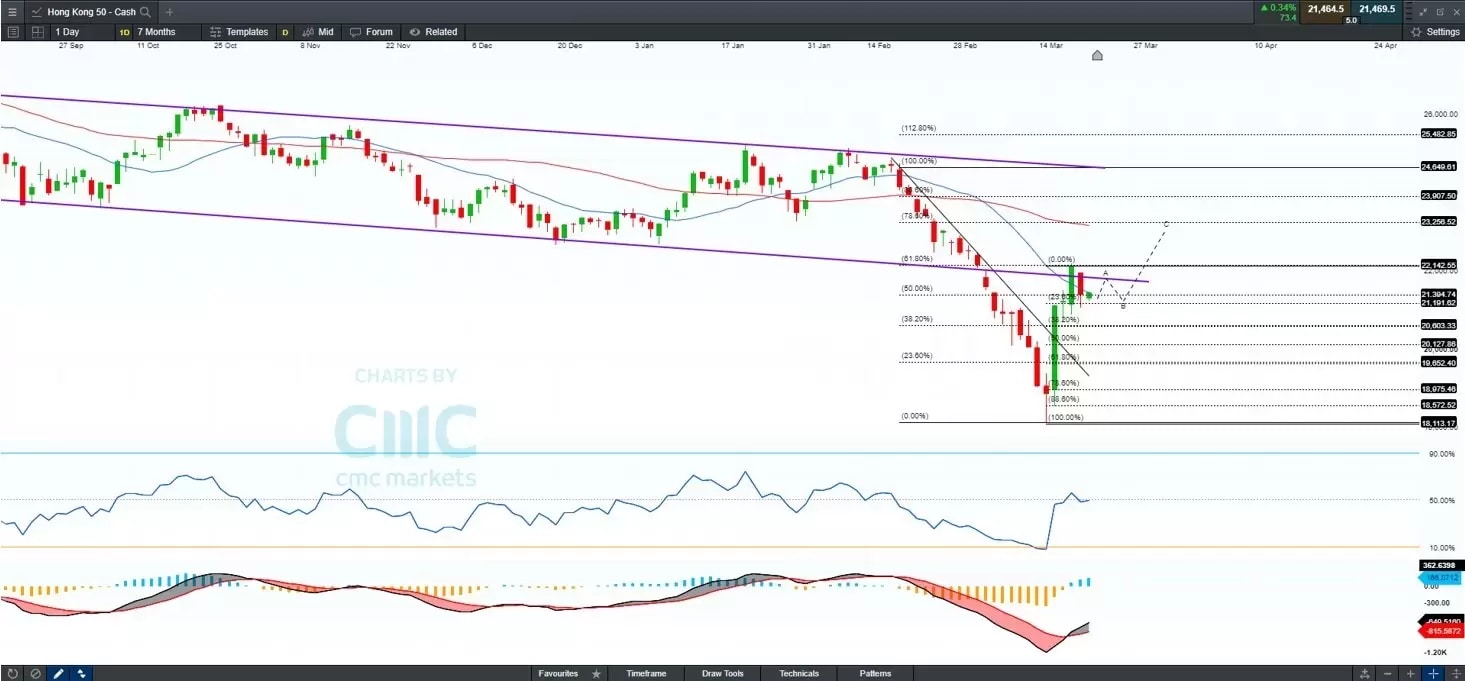
Hong Kong 50 (cash) - Daily chart

Key technical elements:
- MACD forms a golden cross, indicating a potential long-term bottom reversal in place.
- RSI flattens, indicating the short-term upside momentum is somewhat fading.
- The imminent resistance is seen at the 20-day moving average at 21,500, which overlaps with the lower band of the previous descending channel.
Key price levels:
Supports: HK$20,600, HK$20,127
Resistances: HK$21,500, HK$22,142
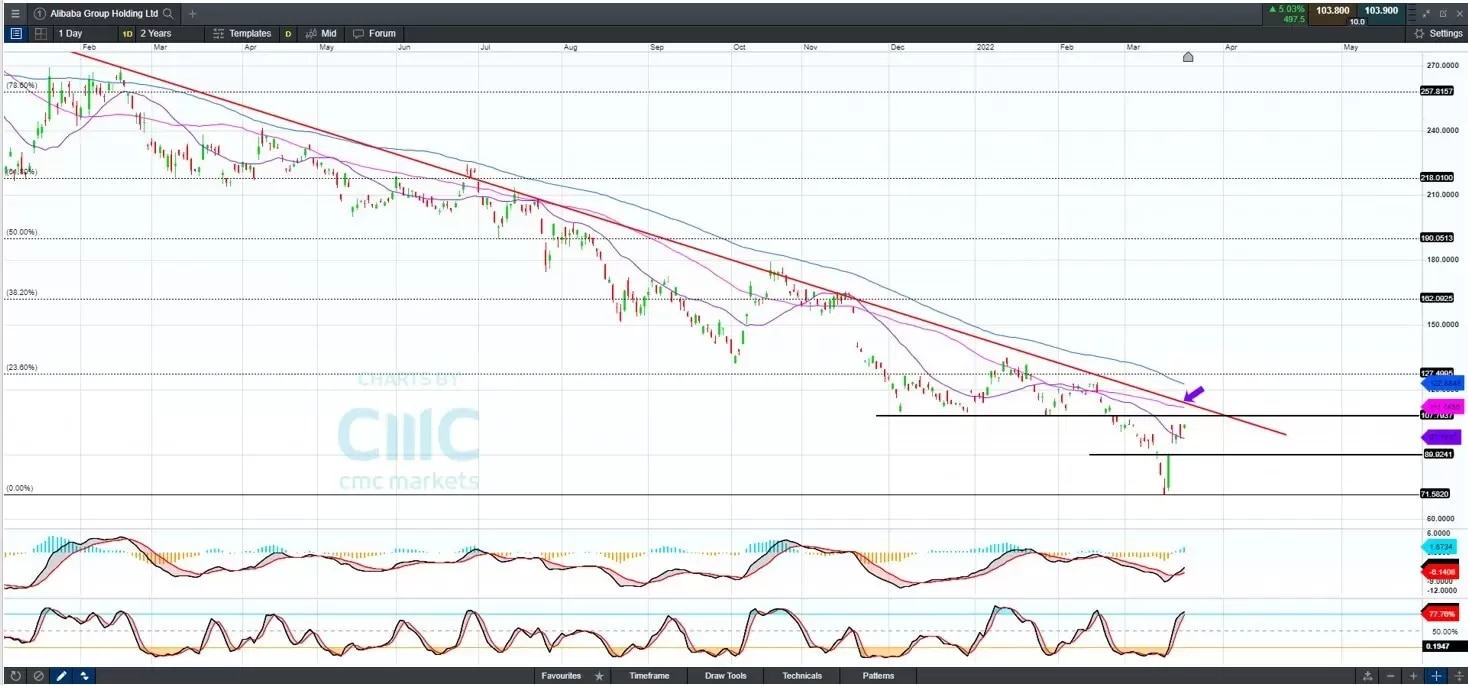
Alibaba - Daily chart

Key technical elements:
- The long-term downtrend is still intact, with the key resistance at the previous support, HK$107.19.
- MACD formed a golden cross, indicating a potential buy signal. The oscillator also provides a potential bullish divergence, with the previous low on December 6 lower than the recent low on March 15, while the price shows an opposite pattern.
- Stochastic is approaching the overbought territory, indicating a possible near-term pullback.
Key price levels:
Supports: HK$94.3, HK$89.92
Resistances: HK$107.80, HK$111.74


