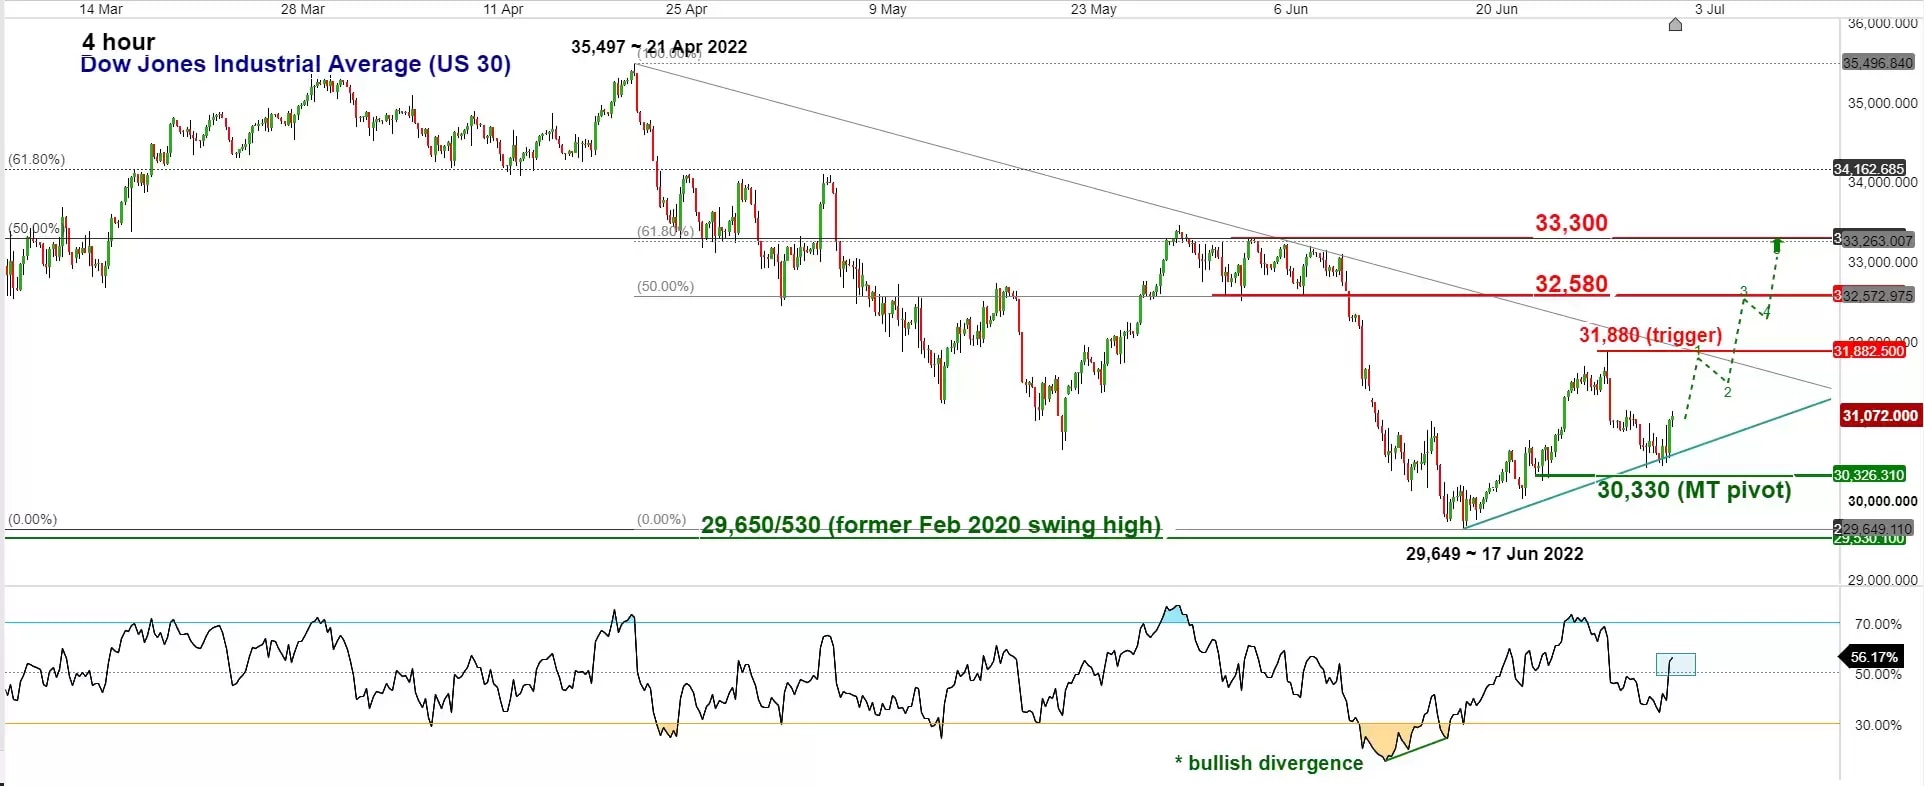
Chart of the week – Dow Jones Industrial Average (US 30)
Revival of positive momentum for Dow Jones Industrial Average (US 30)
Short-term technical analysis (1 to 3 weeks)

- Last week’s decline of -4.6% seen in the US 30 Index (proxy for the Dow Jones Industrial Average) from its 28 June minor swing high to 30 June low has managed to stall at a minor ascending trendline support from 17 June 2022 low. Thereafter, its price action has managed to stage a rebound of +2.15% and recorded a positive daily close on last Friday, 1 July 2022 that snapped the prior three days of “lower lows”.
- Watch the 30,330 key medium-term pivotal support and a break above 31,880 may see a further potential up move towards the next resistances at 32,580 and 33,300 in the first step within a corrective rebound structurethat may last for 1 to 3 months.
- On the other hand, a break with a 4-hour close below 30,330 invalidates the recovery scenario for a continuation of the drop to retest the major support of 29,650/530.
- Positive elements; the 4-hour RSI oscillator has managed to inch higher above the 50% level which indicates a revival of short-term bullish momentum, the -4.6% decline seen on the price actions of US 30 Index from its 28 June minor swing high has managed to pause at the 61.8% Fibonacci retracement of prior short-term up move from 17 June 2022 low to 28 June 2022 high which increases the odds of the emergence of another short-term up move sequence based on Elliot Wave/fractal analysis.


