Chart of the week – Bitcoin (USD)
Potential new all-time high on sight for Bitcoin (USD) (short-term technical analysis)

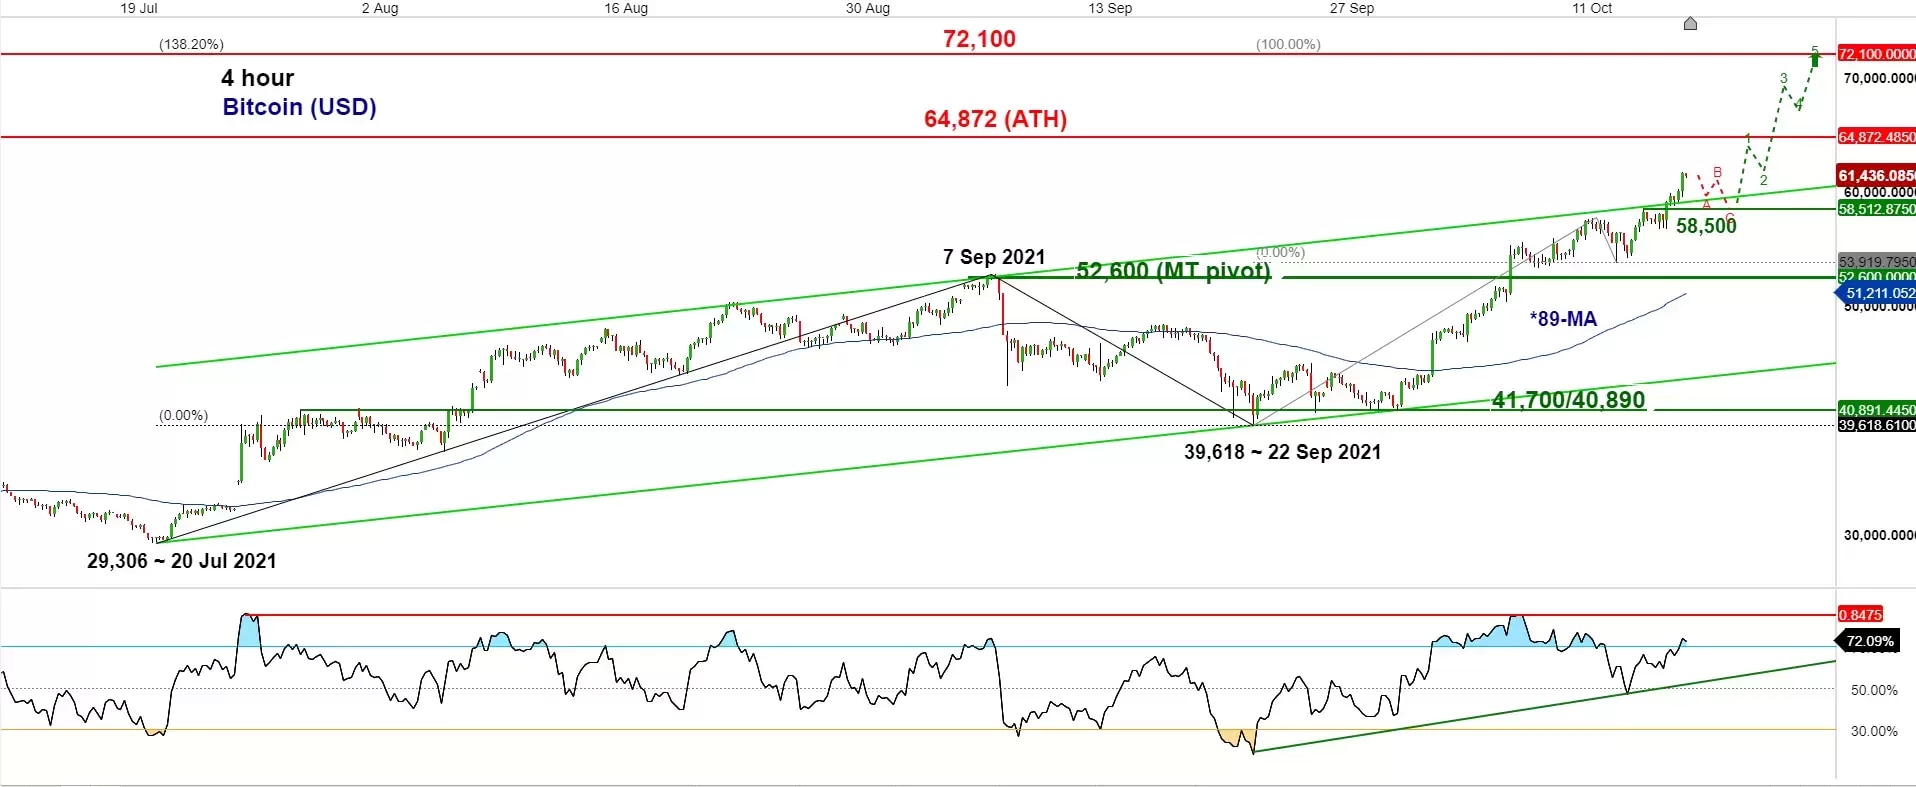
- The recent up move of +56% seen in Bitcoin (USD) from its minor base formed on 20 to 30 September has accelerated via the bullish breakout above the upper boundary of its medium-term ascending channel on 15 October.
- Last Friday, 15 October close of 61,436 is now just a whisker away from its current all-time high of 64,872 printed on 14 April 2021 without any clear signs of bullish exhaustion yet which indicates that the medium-term uptrend phase from 20 July 2021 low remains intact.
- As prices do not always move in a vertical fashion within an up-trending phase where pull-back/consolidation tends to occur before new series of “higher highs” emerge. The 4-hour RSI oscillator is now fast approaching an extreme overbought level of 85% which increases the odds of a looming minor pull-back.
- Hence, Bitcoin (USD) may stage a pull-back first towards the 58,500 intermediate support with a maximum limit set at the 52,600 key medium-term pivotal support before a new potential impulsive up move materialises towards the next significant resistance at 72,100 (a cluster of Fibonacci expansion levels).
- On the flipside, a 4-hour close below 52,600 put the bullish tone on hold for another round of corrective decline towards the next support zone of 41,700/40,890 within the major uptrend phase that is still evolving since March 2020 low.


