Chart of the week-Australia 200
Potential bullish reversal for Australia 200
Short-term technical analysis

Time stamped: 16 May 2021 at 12:00 pm SGT
Source: CMC Markets
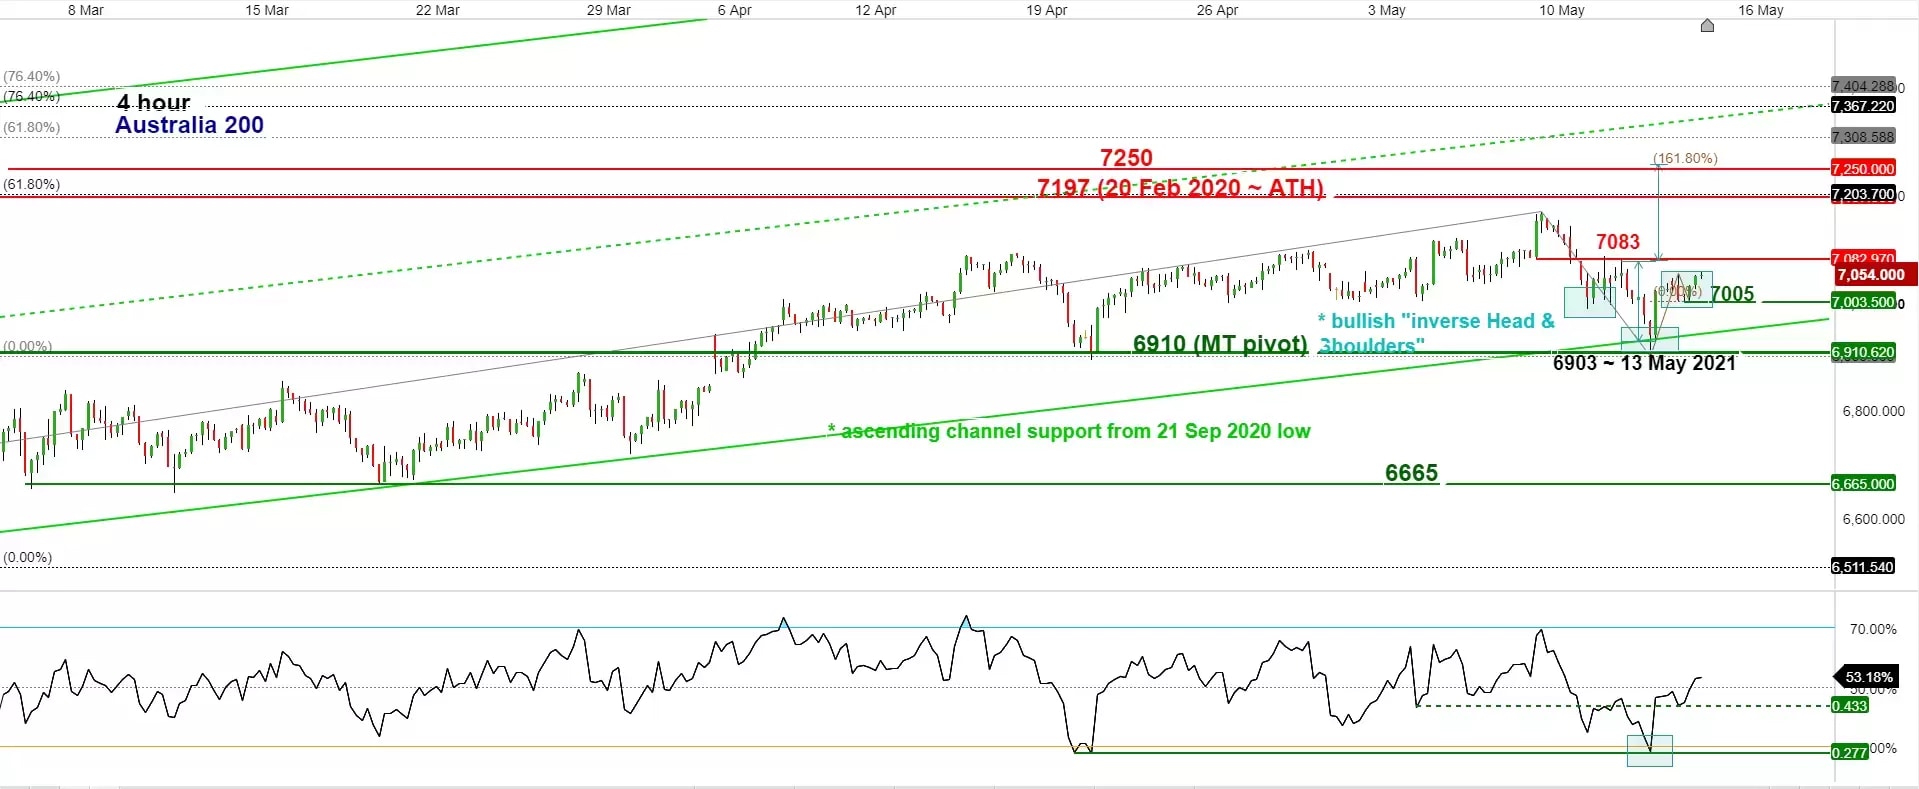
- The recent -3.7% decline seen on the Australia 200 (proxy for ASX 200) from its 52-week high of 7,171 printed on 10 May to last Thursday, 13 May low of 6,903 has started to exhibit several positive technical elements.
- Positive technical elements; the aforementioned -3.74% decline has stalled right at the medium-term ascending channel support in place since 21 September low of 5,724, former swing low area of 21 April, 50% Fibonacci retracement of the recent up move from 19 March low to 10 May high, price actions have started to form a short-term bullish reversal “Inverse Head & Shoulders” configuration since 14 May and the 4-hour Relative Strength Index has exited from its oversold region with a break above the former corresponding 43% resistance level that indicates a potential revival of short-term upside momentum of price action.
- As long as the 6,910 key medium-term pivotal support holds and a break above the 7,083 intermediate neckline resistance of the “Inverse Head & Shoulders” may trigger the start of another impulsive up move to retest the current all-time high of 7,197 before targeting the next resistance at 7,250 (potential bullish breakout exit target of the Inverse Head & Shoulders & the 1.618 Fibonacci expansion level from 13 May low).
- However, a 4-hour close below 6,910 is likely to negate the bullish tone for a deeper corrective decline towards the next support at 6,665 (the range bottom from 5 March to 19 March).


