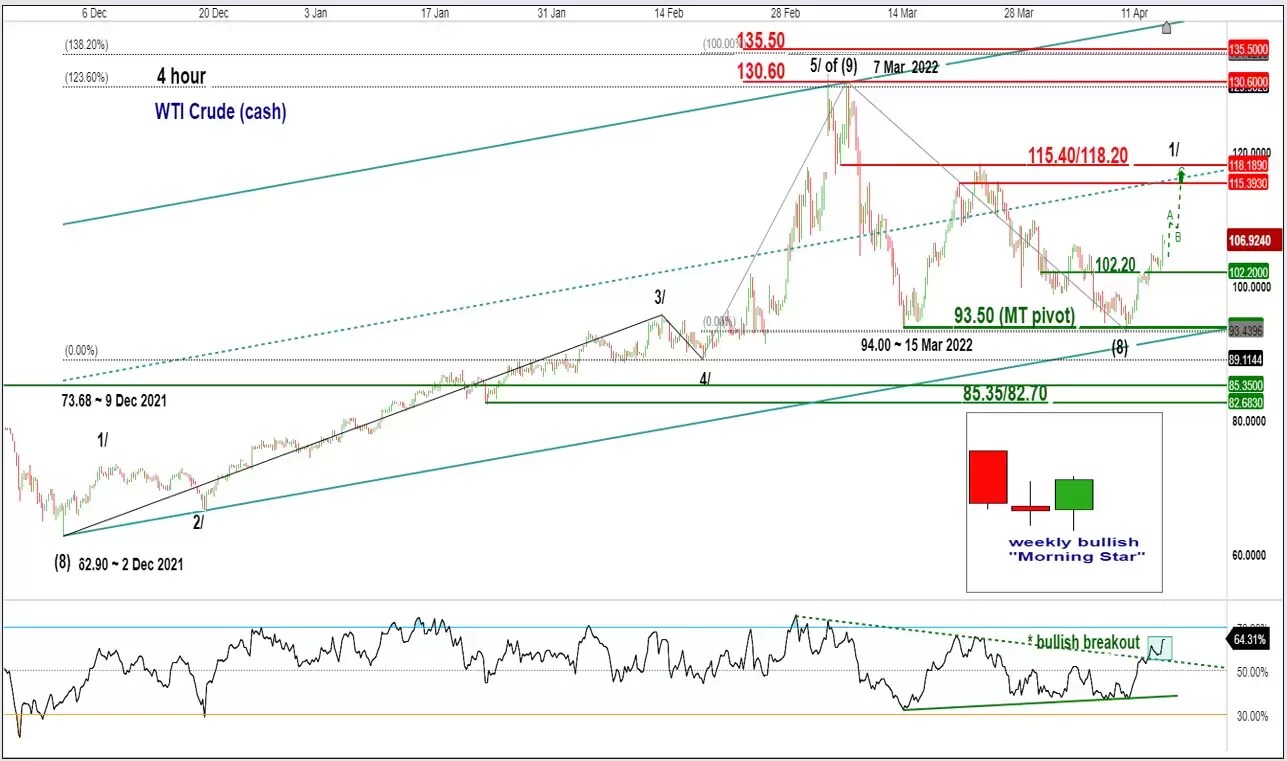
Chart of the week – WTI Crude
Potential bullish impulsive movement resumes for WTI Crude
Short to medium-term technical analysis

Source: CMC Markets
- The recent 6-week of corrective decline/consolidation seen in WTI Crude (cash) that recorded a decline of -29% from its 7 March 2022 high of 131.83 is likely to have formed a medium-term swing low on 11 April 2022 that may kickstart another leg of potential impulsive up move sequence within its medium-term uptrend phase that remains intact since its 2 December 2021 low of 62.90.
- Several technical elements are supporting the aforementioned recovery scenario; short-term momentum reading has turned positive as depicted by the movement of the 4-hour RSI oscillator as it has staged a bullish breakout from its former corresponding descending resistance on 13 April 2022 after it has flashed a prior bullish divergence signal.
- Secondly, price actions have just formed a weekly bullish reversal “Morning Star” candlestick pattern that indicates a potential major (seen on a weekly chart rather than shorter time horizons) inflection point for a change in sentiment from bearish to bullish.
- If the 93.50 key medium-term pivotal support holds, WTI Crude (cash) is likely to see a further potential up move towards the 115.40/118.20 resistance zone in the first step (24 March 2022 swing high area & a cluster of Fibonacci extension/retracement levels).
- On the flipside, a break with a 4-hour close below 93.50 invalidates the recovery scenario for an extension of the corrective decline towards the next support at 85.35/82.70 (the former swing high areas of 25 October 2021/1 November 2021/10 November 2021).


