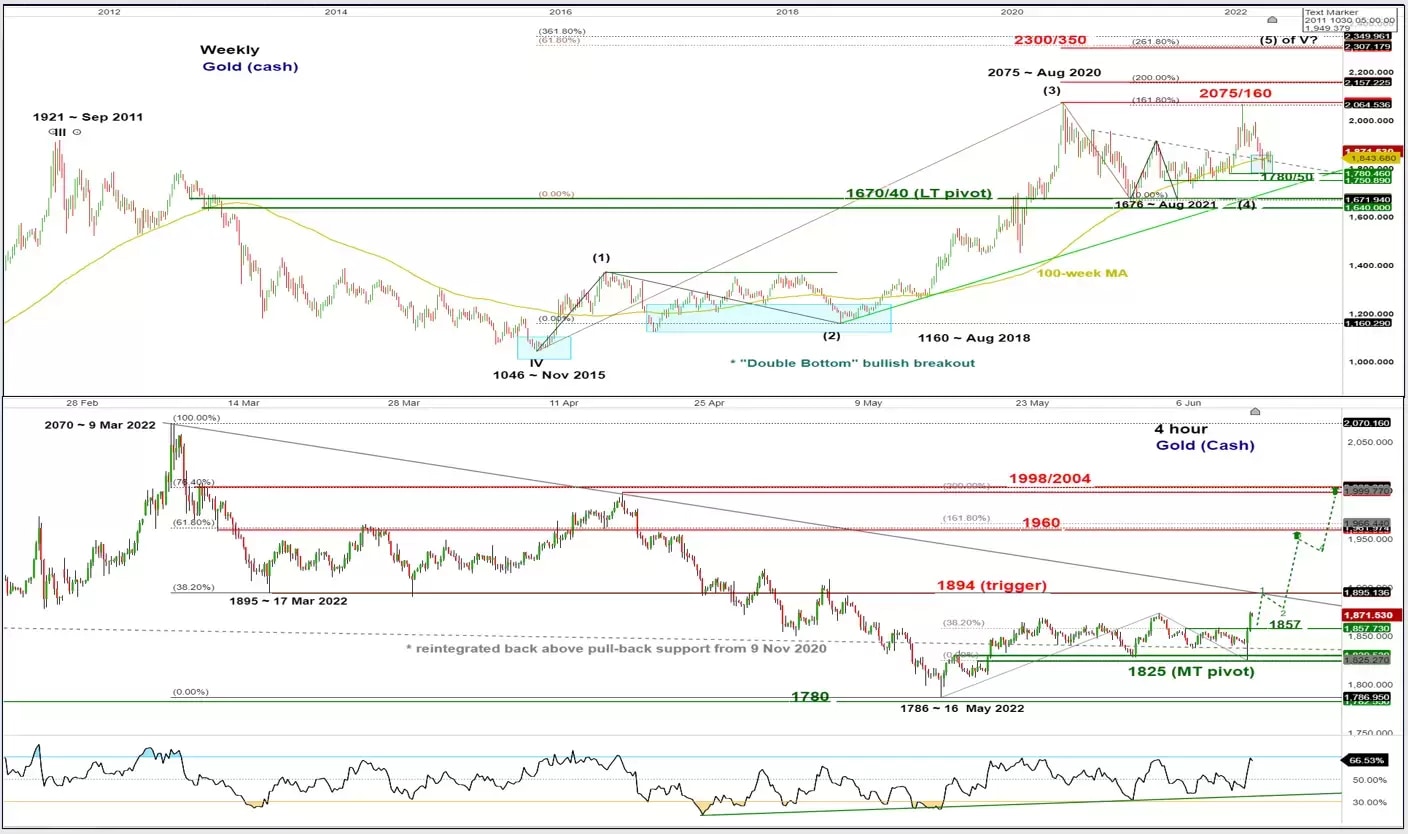
Chart of the week – Gold (cash)
Gold gets a lift off from risk off
Short-term technical analysis (1 to 3 weeks)

Time stamped: 12 Jun 2022 at 12:00pm SGT
Source: CMC Markets
- In the past week, global equities have wobbled where the major US stock indices, the S&P 500 and Nasdaq 100 recorded weekly losses of -5.06% and -5.70% respectively; their worst weekly performances since 18 January 2022.
- In contrast, Gold has outperformed against equities during last week’s risk-off environment, it recorded a weekly gain of +1.07% and an accumulated return of +4.7% from its 16 May 2022 low of 1,786.
- Integrated technical analysis (price actions, momentum & Elliot Wave/fractals) suggests that a potential medium-term inflection low point for Gold (cash) may have materialised on 16 May 2022, and it is likely to stage a further potential impulsive up move sequence in the next 1 to 3 weeks within its major range configuration in place since August 2020 high of 2,075.
- Bullish bias above 1,825 key medium-term pivotal support and a break above 1,894 upside trigger level is likely to reinforce a further potential up move towards the next resistances at 1,960 and 1,998/2004 next.
- On the flipside side, a break with a 4-hour close below 1,825 invalidates the bullish scenario for another round of choppy decline to retest the 7/27 January 2022 swing low areas of 1,780.
- Positive elements; the recent past 4 weeks of price actions seen in Gold (cash) has reintegrated back above its 100-week moving average and the pull-back support of a former descending resistance from 9 November 2020 high, daily RSI oscillator has just broken above its 50% level after it hit an oversold condition on 13 May 2022 which indicates a revival of medium-term upside momentum.


