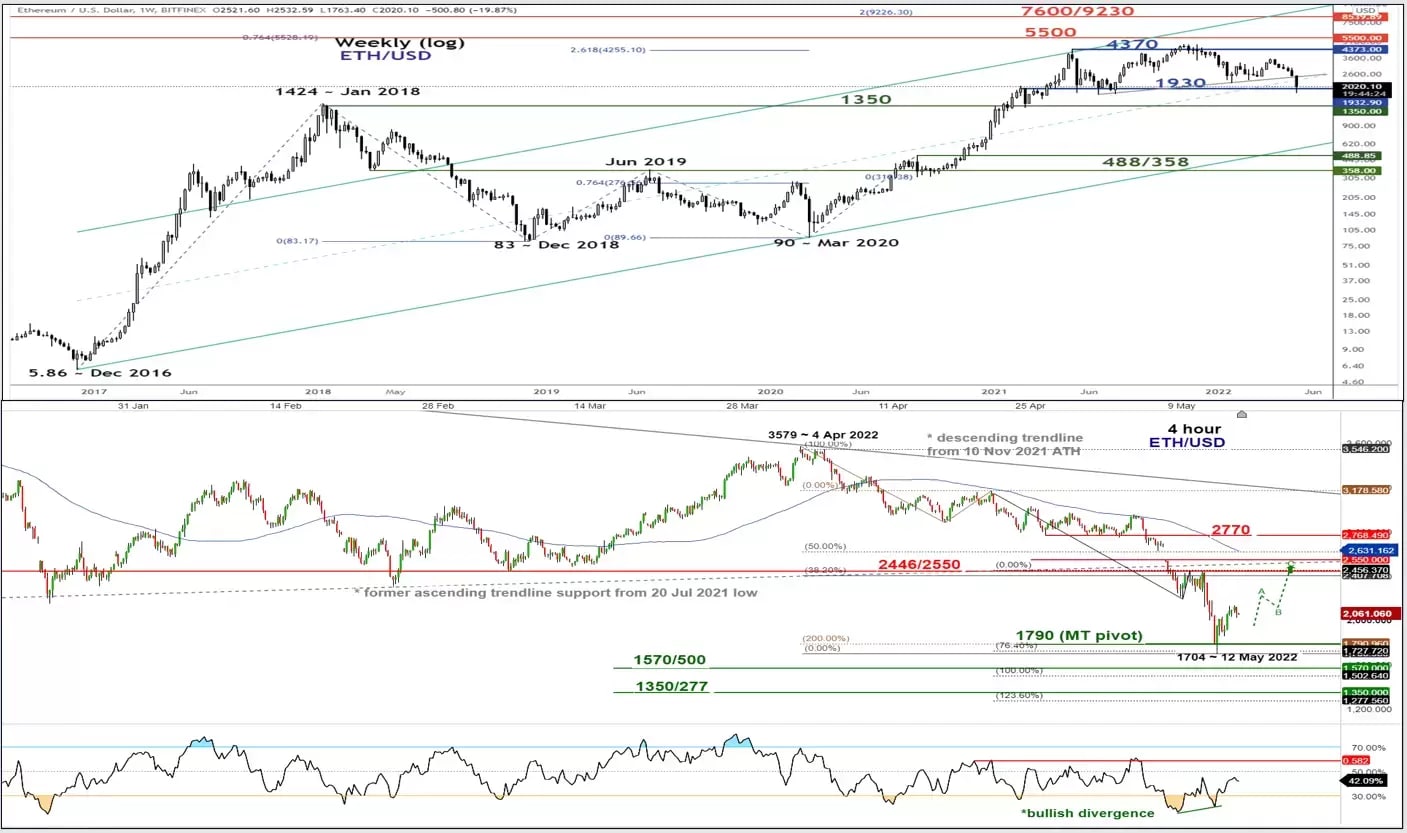
Chart of the week – Ethereum
Ethereum plummeted to major range support, a potential mean reversion rebound looms
Short to medium-term technical analysis

Source: CMC Markets & TradingView
- The unpegging of TerraUSD (UST) stablecoin from its 1 to 1 peg against the US dollar has triggered a death spiral in the cryptocurrencies space for the past week as market participants questioned the trust and utility value in DeFi (decentralised finance) tokens and applications. Even the majors; Bitcoin (BTC/USD) and Ethereum (ETH/USD) could not escape the bloodbath as both plummeted by -34% and -38% respectively in the past two weeks reinforced by weak sentiment seen in risk assets such as equities.
- The recent steep decline seen in Ethereum (ETH/USD) has hit and challenged its major range support of 1,930 (printed an intraday low of 1,704 on 12 May 2022 based on data from CMC Markets platform) before it reversed up and closed higher on Friday, 13 May at 2,061). Based on data from TradingView, ETH/USD is trading at 2,015 at this time of the writing on the weekend of Sunday, 15 May.
- The 1,930 major range support (see weekly chart) is considered as a key inflection level as it is defined by a graphical support that has stalled a prior plunge of -60% from its May 2021 high to June 2021 low and confluences with a cluster of Fibonacci retracement/extension levels).
- Hence, watch the 1,790 key medium-term pivotal support for a potential mean reversion rebound to retest the 2,446/2,550 intermediate resistance zone and a break above it may see an extension towards 2,770 next. However, a break with a daily close below 1,790 opens up scope for another impulsive down move towards the next supports at 1,570/1,500 and 1,350/1,277 (former major swing high area of January 2018) that put the major uptrend phase since March 2020 low in jeopardy.
- Positive elements; the 4-hour RSI oscillator has flashed a bullish divergence signal at its oversold region which indicates that the recent downside momentum has started to abate and the 1,790 swing low area of 12 May 2022 confluences with a cluster of Fibonacci extension levels that increases the odds of a short to medium-term bullish reversal in price actions.


