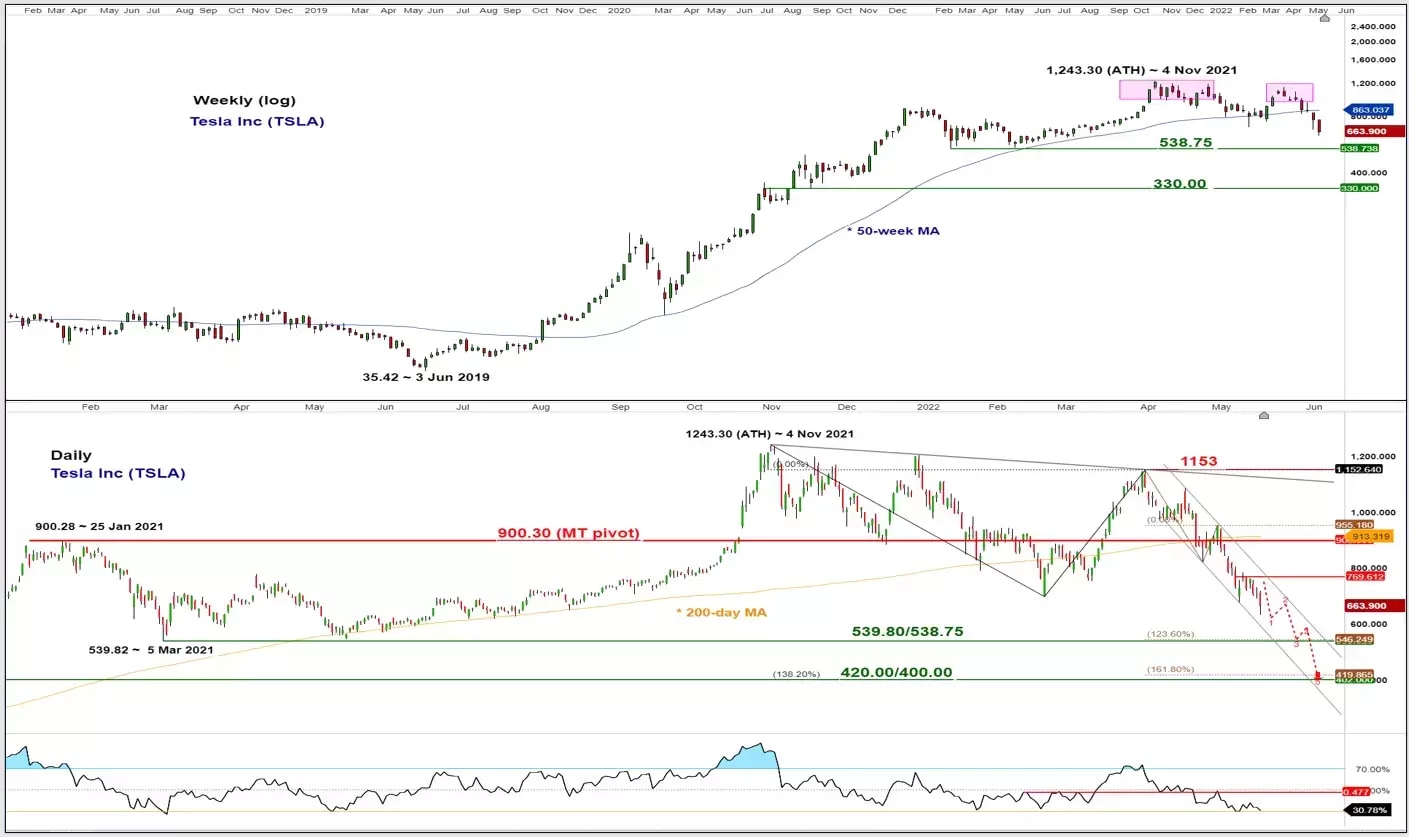
Chart of the week – Tesla (TSLA)
End of major uptrend for Tesla (TSLA)
Medium-term technical analysis (1 to 3 months)

Source: CMC Markets
- After its failure to break above the 1,153 descending trendline resistance on 5 April 2022, Tesla (TSLA) has plummeted by -45% to print a recent low of 633.00 on 20 May 2022 and it has recorded a decline of -49% from its current all-time high of 1,243.30 printed on 4 November 2021.
- No clear signs of a medium-term bottoming process yet. Bearish bias in any bounces below 900.30 key medium-term pivotal resistance for another potential impulsive down move towards the next supports at 539.80/538.75 and 420.00/400.00.
- However, a clearance with a daily close above 900.30 invalidates the bearish scenario for a corrective rebound to retest the range resistance of 1,153.00
- Bearish elements; TSLA has broken below its 50-day week moving average that held prior price actions since mid-October 2019, current price actions have oscillated within a descending channel in place since 21 April 2022 high and no clear bullish divergence signal has been flashed out in the daily RSI oscillator at its oversold region.


