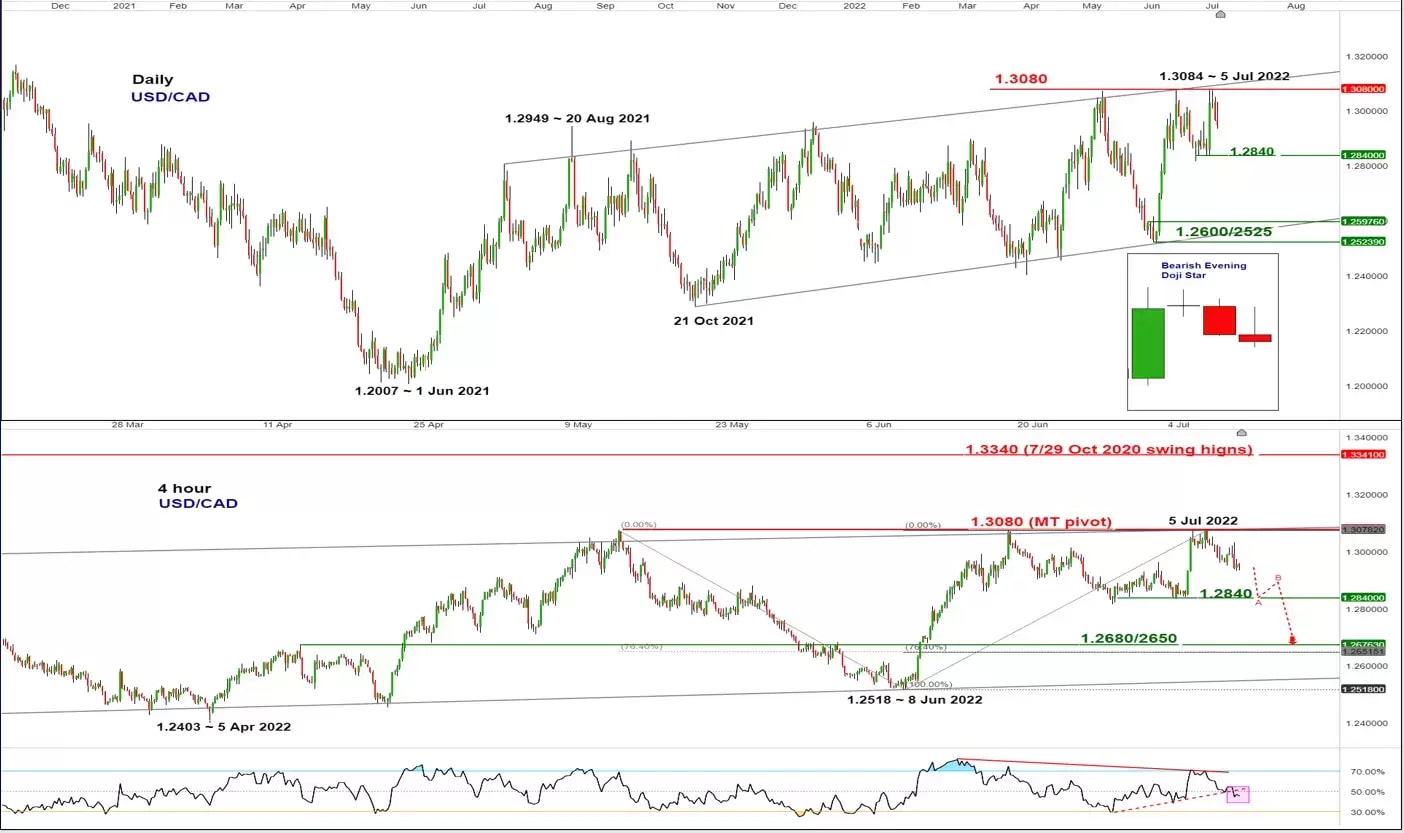
Chart of the week – USD/CAD
Bearish signals sighted in USD/CAD ahead of BoC meeting
Short-term technical analysis (1 to 3 weeks)

Time-stamped: 9 Jul 2022 at 3:00pm SGT
Source: CMC Markets
- Bank of Canada will meet this Wednesday, 13 July to decide on its monetary policy outcome.
- From an integrated technical analysis perspective, the +560 pips rally seen on USD/CAD from its 8 June 2022 low of 1.2518 may have reached an exhaustion/inflection point on 5 July 2022 where the next potential trajectory for USD/CAD is likely skewed towards the downside in the short-term.
- Watch the 1.3080 key medium-term pivotal resistance for a potential drop to retest its intermediate support at 1.2840 and a break below it may see a further downside acceleration towards the next support at 1.2680/2650 (former minor swing high of 13 April 2022 & a cluster of Fibonacci retracement/extension levels) in the first step.
- However, a 4-hour close above 1.3080 invalidates the bearish scenario and triggers a bullish breakout above the upper boundary of its one-year ascending range configuration for a further up move towards the next resistance at 1.3340 (also the 50% Fibonacci retracement of prior major downtrend phase from 19 March 2020 high to 1 June 2021 low).
- Negative elements; it has formed a daily “Evening Doji Star” bearish reversal candlestick pattern (taking into account the price actions of 5/6/7 July 2022) right at the 1.3080 ascending range resistance, short-term downside momentum remains intact as the 4-hour RSI has just staged a bearish breakdown from its corresponding ascending support at the 50% level and still has not reached an extremely oversold level.


