Chart of the week – Bank of America
Bank of America at risk of medium-term setback within major uptrend
Medium-term technical analysis

Time stamped: 11 Jul 2021 at 1:00pm SGT
Source: CMC Markets
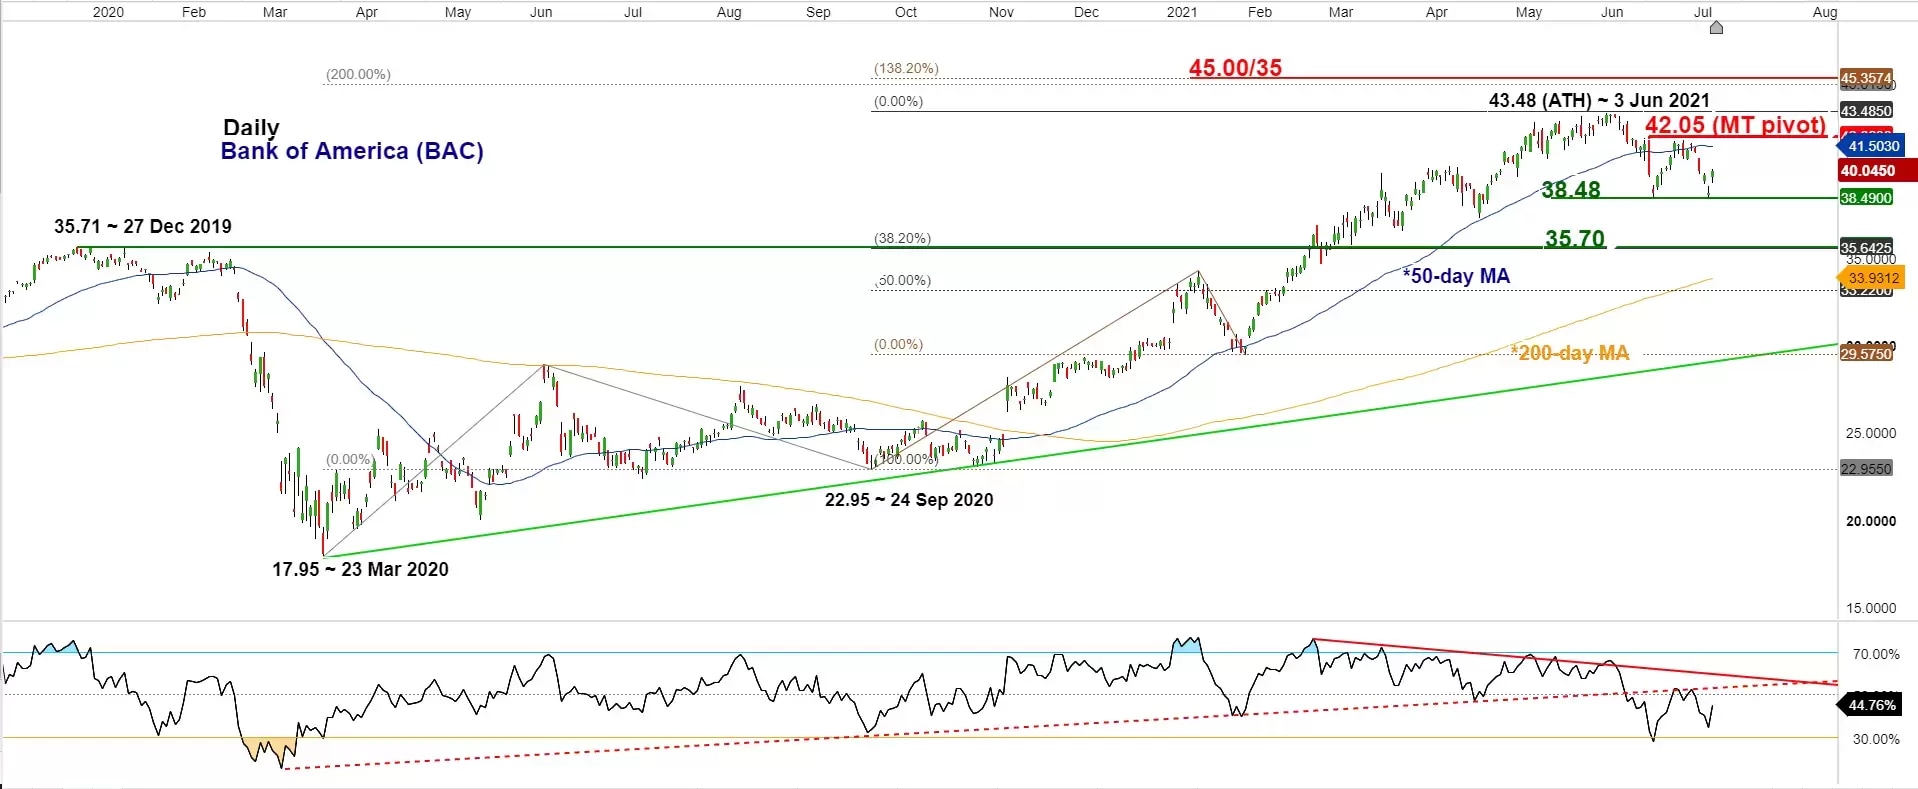
- Since its recent current all-time of 43.48 printed on 3 June 2021, the share price of Bank of America (BAC) has declined by -11.5% to hit an intraday low of 38.48 on 8 July, last Thursday. BAC will announce its Q2 2021 earnings result on 14 July, Wednesday before the US session opens.
- BAC has continued to trade below its flattened 50-day moving average in the past three weeks accompanied by the daily Relative Strength Index (RSI) that has remained below a corresponding significant resistance at the 58% level. These observations suggest the lack of upside momentum and BAC still faces the risk of a further potential medium-term (multi-week) corrective decline within a major uptrend phase in place since 23 March 2020 low of 17.95.
- Watch the 42.05 key medium-term pivotal resistance for a potential drop to retest 38.48 and a break below it may see a further decline towards the next support at 35.70 (the former range resistance of 27 December 2019, 38.2% Fibonacci retracement of multi-month up move from 24 September 2020 low to 3 June 2021 high & the 200-day moving average).
- On the other hand, a daily close above 42.05 invalidates the corrective decline scenario to open up scope for another impulsive up move sequence to target the next resistance zone at 45.00/45.35 (a cluster of Fibonacci expansion levels).


