


Chart of the week – Gold (Cash)
A potential short-term bullish reversal configuration for Gold
Short-term technical analysis
Source: CMC Markets
Time stamped: 6 Mar 2021 at 2.30 pm SGT
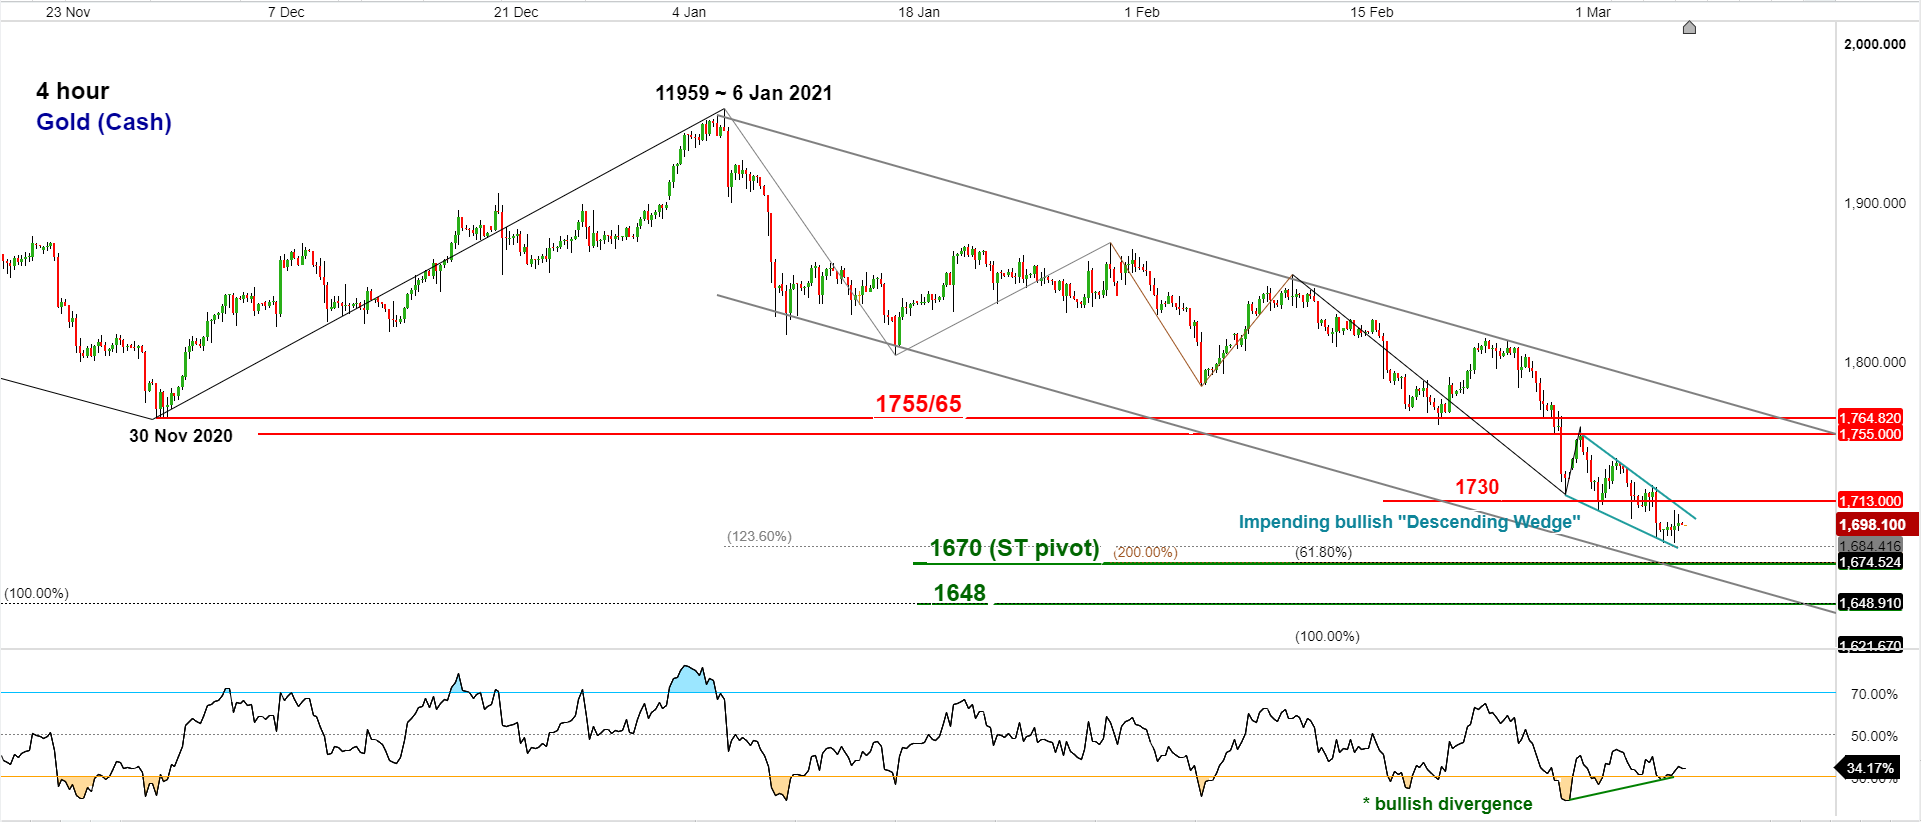
- The recent -4% decline seen in Gold (cash) from its 1 March 2021 high of 1,1760 has started to trace out an impending short-term bullish reversal configuration, “Descending Wedge” within its medium-term downtrend in place since 6 January 2021 high of 1,1959.
- In addition, the 4-hour RSI oscillator has traced out a bullish divergence signal at its oversold region which suggests that recent short-term downside momentum has started to wane.
- Key short-term pivotal support to watch will be a 1,670 and a break above 1,730 (upper boundary of the “Descending Wedge” may trigger a potential rebound to retest 1755/65 resistance zone which also confluences with the upper boundary of the aforementioned medium-term descending channel.
- However, a break below 1,670 invalidates the short-term rebound scenario for a further slide towards the next support at 1,648 (ascending trendline from 21 May 2019 low & 1.00 Fibonacci expansion of the decline from 7 August 2020 high to 30 November 2020 low projected from 6 January 2021 high).


