Chart of the week –Tesla (TSLA)
Tesla (TSLA) at risk of a further potential drop to retest 4-month range support
Medium-term technical analysis

Time stamped: 25 Jul 2021 at 2:00pm SGT
Source: CMC Markets
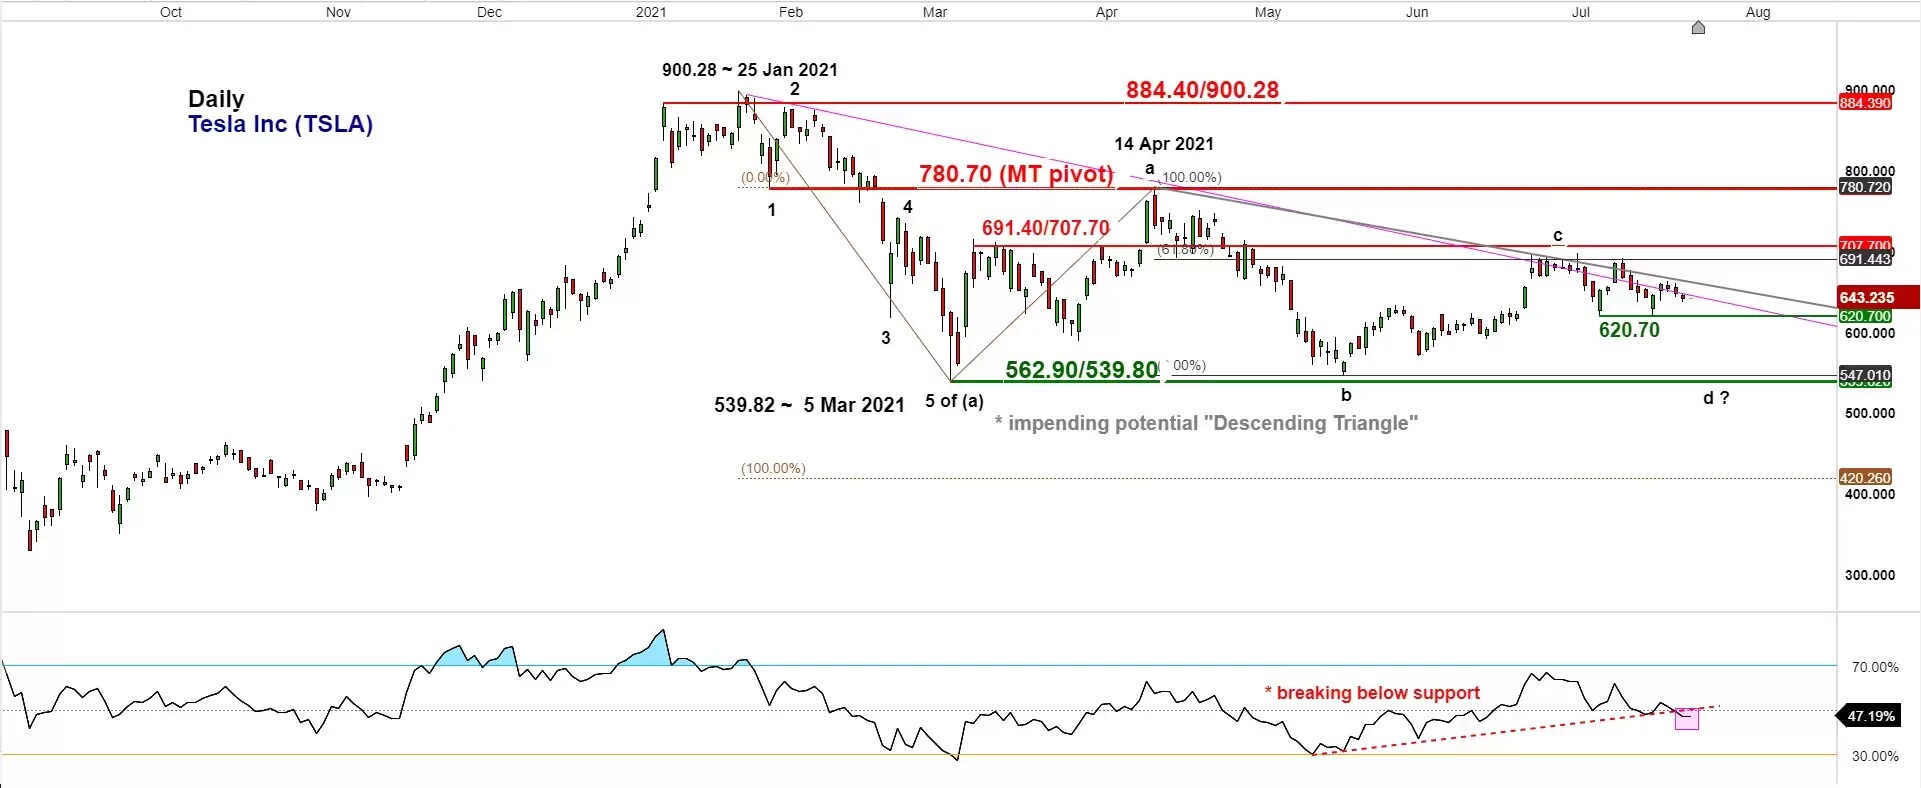
- After a plunge of -40% from its current all-time high of 900.28 printed on 25 January 2021 to a recent low of 539.82 on 5 March, the share price of Tesla Inc (TSLA) has continued to evolve within a 4-month medium-term “Descending Triangle” range configuration in light of its impending Q2 earnings result release on Monday, 26 July after the close of the US session.
- Its recent price actions since 24 June high of 697.60 has retested and shaped a series of “lower highs” right below the upper boundary of the “Descending Triangle” that acted as an immediate resistance at around 691.40/707.70.
- In addition, the daily Relative Strength Index (RSI) has flashed out a bearish breakdown below a significant corresponding ascending support at the 50% level in place since 13 May. These observations suggest the lack of upside momentum and the risk of a further drop in price action increases at the juncture.
- Watch the 780.70 key medium-term pivotal resistance and a break below 620.70 intermediate support may see a further drop to retest the “Descending Triangle” range support at 562.90/539.80. On the other hand, a daily close above 780.70 invalidates the push down scenario for a squeeze up to retest the current all-time high area of 884.40/900.28.


