More often than not, the word boring has negative connotations. And it isn’t a word we’d usually use to describe a financial market or financial trading.
Take the Crude Oil market as an example. The chart for Black Gold presents a clear and steady trend that continues to deliver technical trading opportunities in the shape of the same repeated pattern, occurring over and over. It doesn’t swing wildly in each direction. That could be labelled by some as boring. But for a technical trader, this kind of market can be quite exciting. Allow me to explain.
I start my analysis with a top-down approach. I want to see that the trend on my trigger chart is, in fact, in agreement with the overall market trend. I also like to see that there are no levels of support and resistance in the way of my target, and no obstacles in the path of this potential ride.
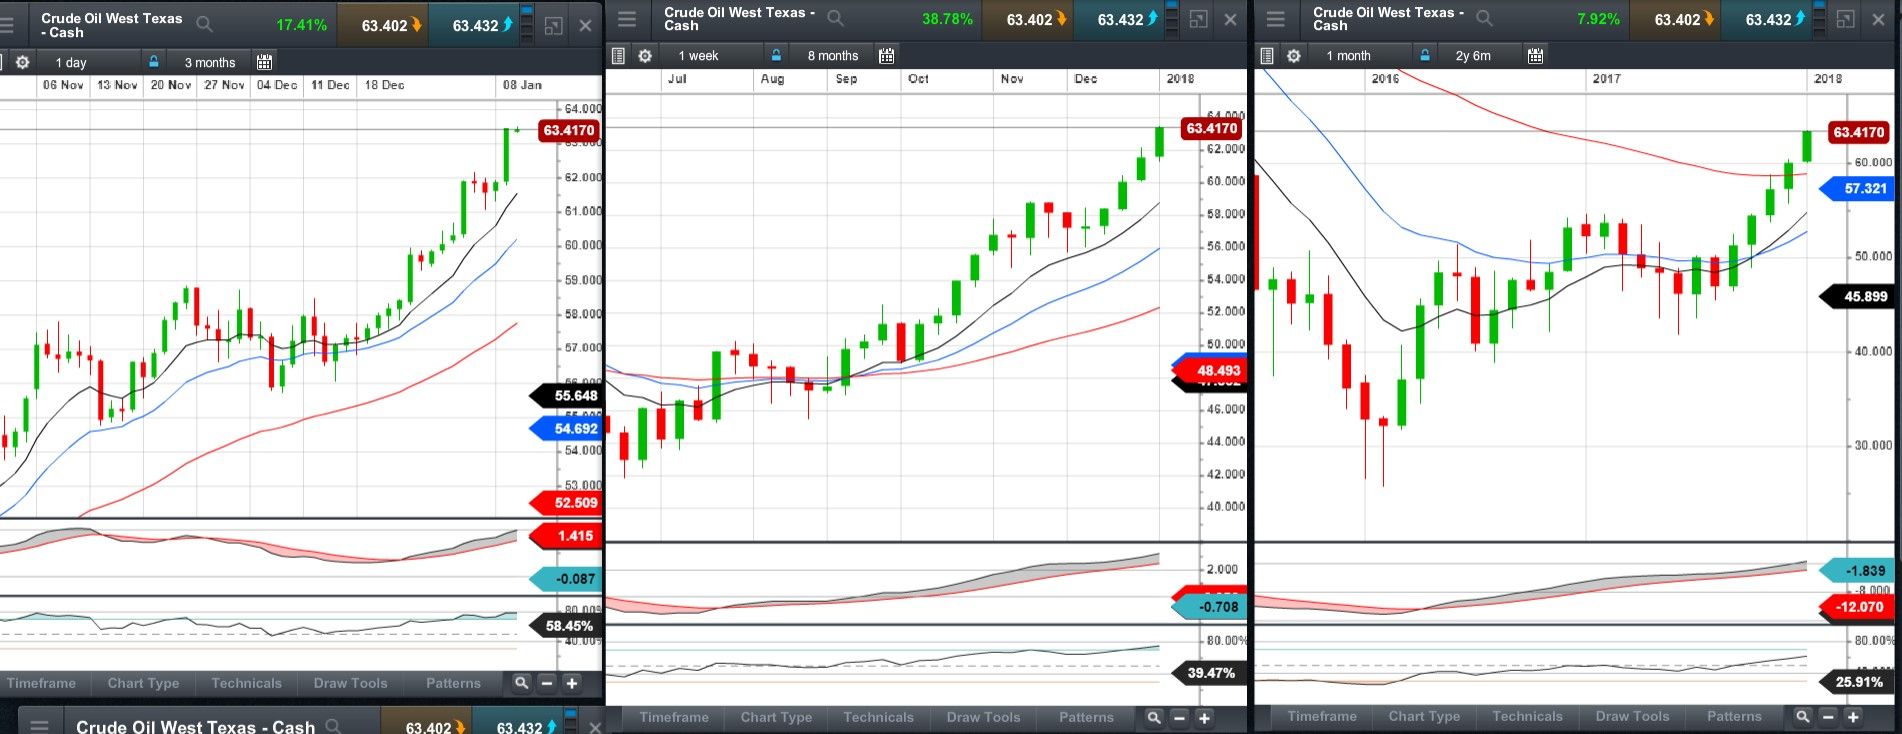
Looking at the monthly, weekly and daily charts, we can see that we have a strong and established uptrend on all these timeframes. We have the moving averages (MAs) fanning and in the correct order on the daily and the weekly chart, and we have good convergence between price action and the momentum indicators in all of these timeframes.
Now let’s look at the mid timeframes. Once again, we’ve got a well- established uptrend, with the MAs fanning and in the correct order, and convergence on the momentum indicators.
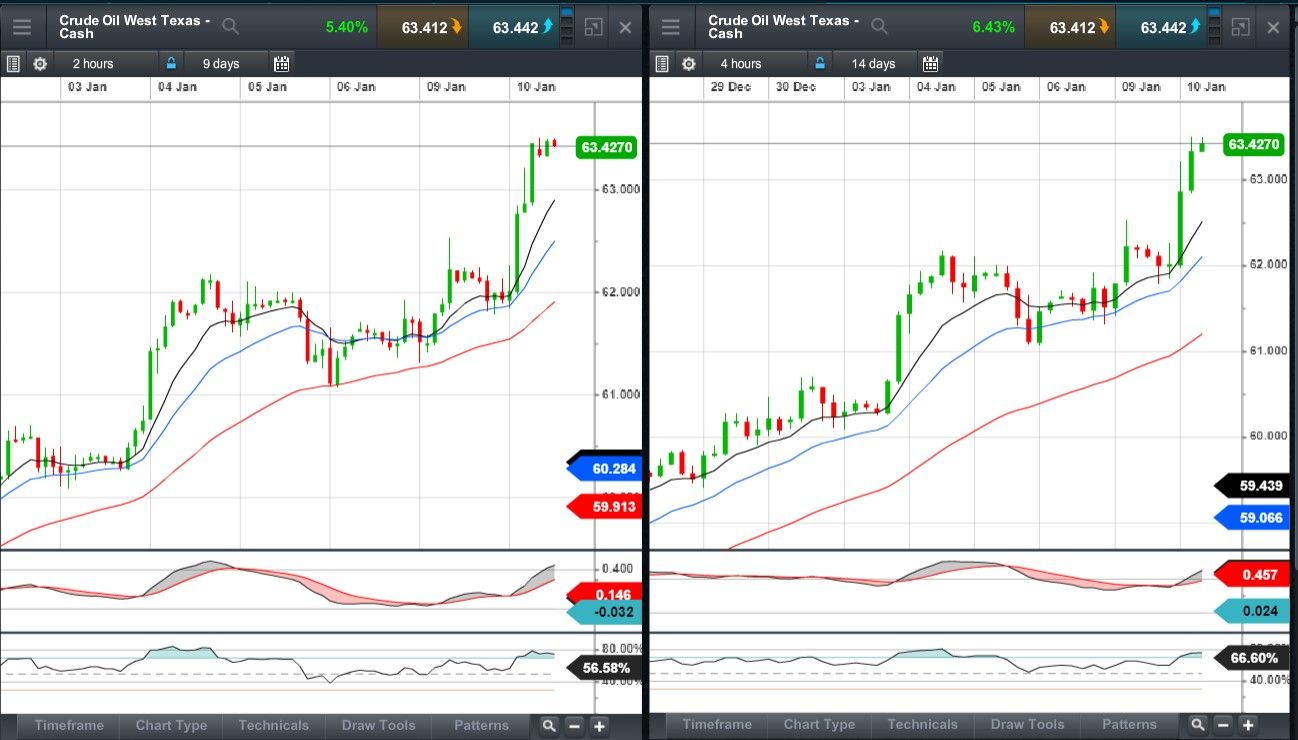
We see that the latest price move has printed a new high, however this move has pushed the market far from the buy zone, which is the area between the 10 and 20 MAs and as such, can be described as over-extended. So I am now looking for a pullback into this zone for a potential technical long setup.
Now let’s layer a few more technical ingredients on the two-hour chart below. Drawing the Fibonacci retracement from the latest swing low to the latest swing high, the sweet spot - i.e., the area between the 50% to 61.8% retracement clusters with the moving average buy zone area.
Now let’s add another Fibonacci retracement, this time from the previous swing low to the recent high. We can now see that we have a clustering of the 61.8% of the first Fibonacci with the 50% of the second. This clustering of several technical elements, together with a strong and well-established uptrend on all these timeframes, has the potential to offer a high probability trading opportunity.
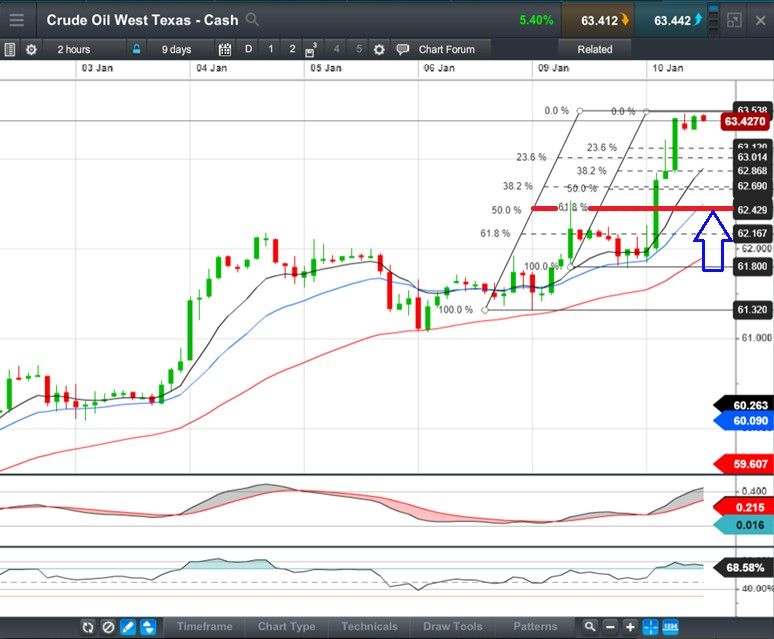
I will be monitoring this area very closely. I’ll be looking for a pullback to test this level from above, then a signal that the pullback is over - such as by forming a small bullish candle in the buy zone. That would indicate this “boring” yet very exciting uptrend is likely to continue.
Tamar Mehr


