Aussie Dollar chart review
It has been a great run for chart traders who bought Aussie three weeks ago when it bounced off trend line support at 75c. However, Fibonacci traders might now be looking to tighten stop losses on long positions.
Weekly chart

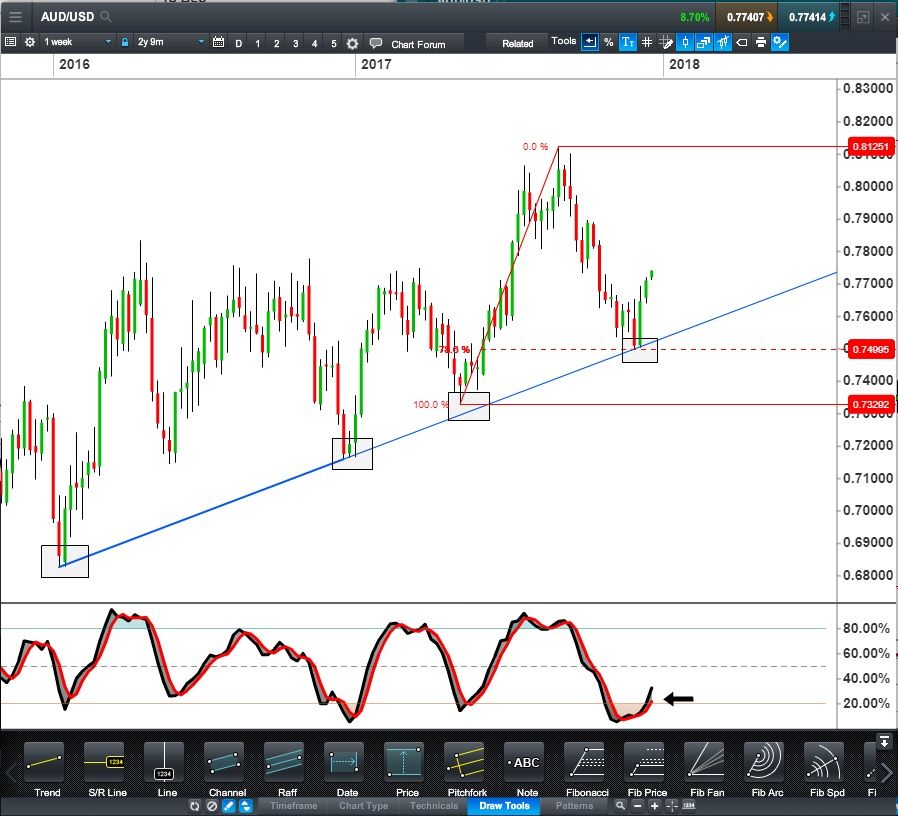
The weekly chart shows the established trend line support in Aussie that began at .6827 in January 2016
The 78.6% Fibonacci retracement level coincided with this trend line when the Aussie recently hit it for the fourth time. 78.6% is a common turning point so this would have given extra confidence to trend line traders who like to see chart points confirmed by supporting evidence.
The slow stochastic indicator is also beginning to climb out of the oversold zone below 20%. It did the same thing with the three previous rejections of this trend line. From a big picture point of view, this suggests the latest rally might still be in its early stages. (I am using settings of 14, 3, 3 for the slow stochastic)
Daily chart

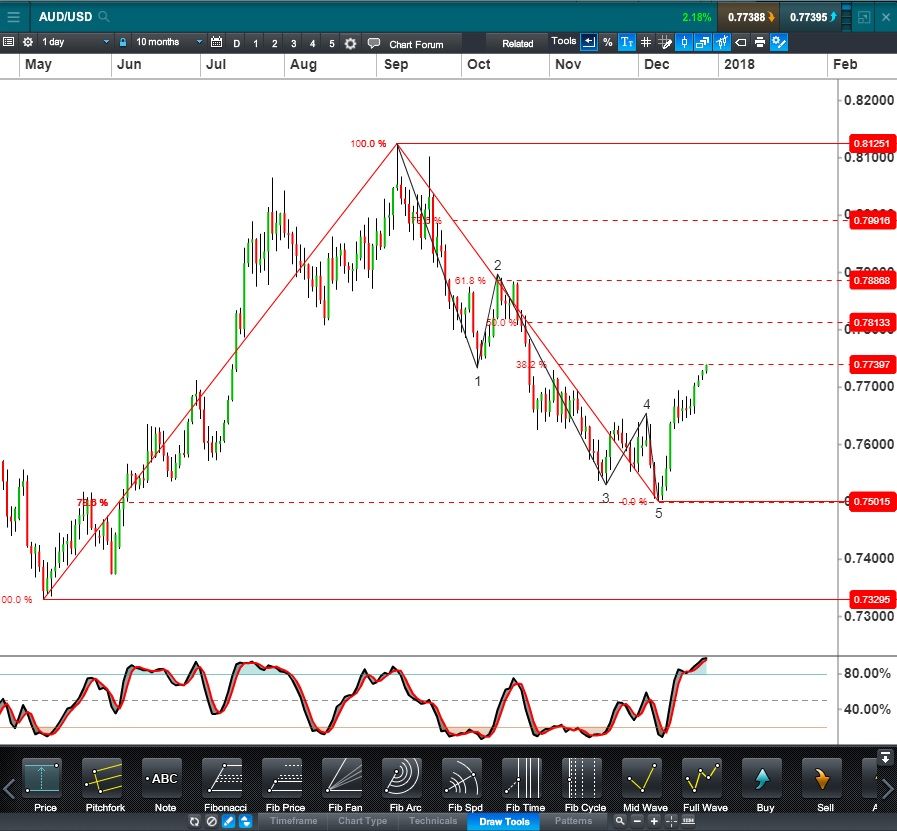
The slow stochastic on the daily chart on the other hand, is now up in the overbought zone above 80%
The Aussie has also arrived at the 38.2% retracement level for the whole move down from .8125 to .7501
38.2% is also a common turning point. It can often see the end of the first swing up in a corrective rally
Timeframes and trading strategy
This is a great example of where traders need to be clear about what timeframes they are trading. A longer-term trader might have a very different strategic response to this situation than swing trader.
Longer –term: A long-term trader might typically use charts with daily candles to make trade entry and exit decisions. This will be the chart used to identify pattern or indicator setups.
However, long-term trader’s controlling chart will be the weekly. This is the chart used to decide trade direction (long or short)
If the weekly is the controlling chart, Aussie looks like a market to trade from the long side. The trend is up and the stochastic is climbing out the oversold zone
Longer-term traders would respond to the risk created by the 38.2% Fibonacci retracement level by tightening stops on existing long positions, perhaps below yesterday’s low. If there is a trend change close to 38.2%, this see long positions closed relatively quickly to protect existing profits. If the market just sails through this level, the stop will trigger and the long position can run further.
Any pull back from 38.2% would be a possible buying opportunity to join current uptrend. If there is a pull back, traders would be on the alert for current buy set ups on the daily chart .e.g. patterns, Fibonacci or indicator based set ups
Swing traders: For these traders, the daily may be the controlling chart while shorter term charts where each candle covers one or 4 hours would be the decision making (execution chart)
Here, with the stochastic over bought, swing trades might be looking for sell set-ups on the hourly chart close to the 38.2% retracement. If trend changed without a set-up, they would typically be on the alert to sell any minor rally after the initial down turn to join a medium term swing lower.
It is all about matching risk and reward: The key things are time management and correctly matching risk to reward. Long-term traders using daily charts do not have to monitor markets nearly as often or actively as shorter-term traders. However, the risk: reward of selling a minor correction against a longer term uptrend may not be justified by the time there is a sell signal on slower reacting daily charts


