Frankly, as a trader, I'll take any help I can get. Although catching break-outs and trend following are favourite activities, the relative simplicity of range trading has appeal. I especially like well-defined ranges. Ranges where the top and bottom have proved a turning point on multiple occasions. Which brings us to AUD/USD.
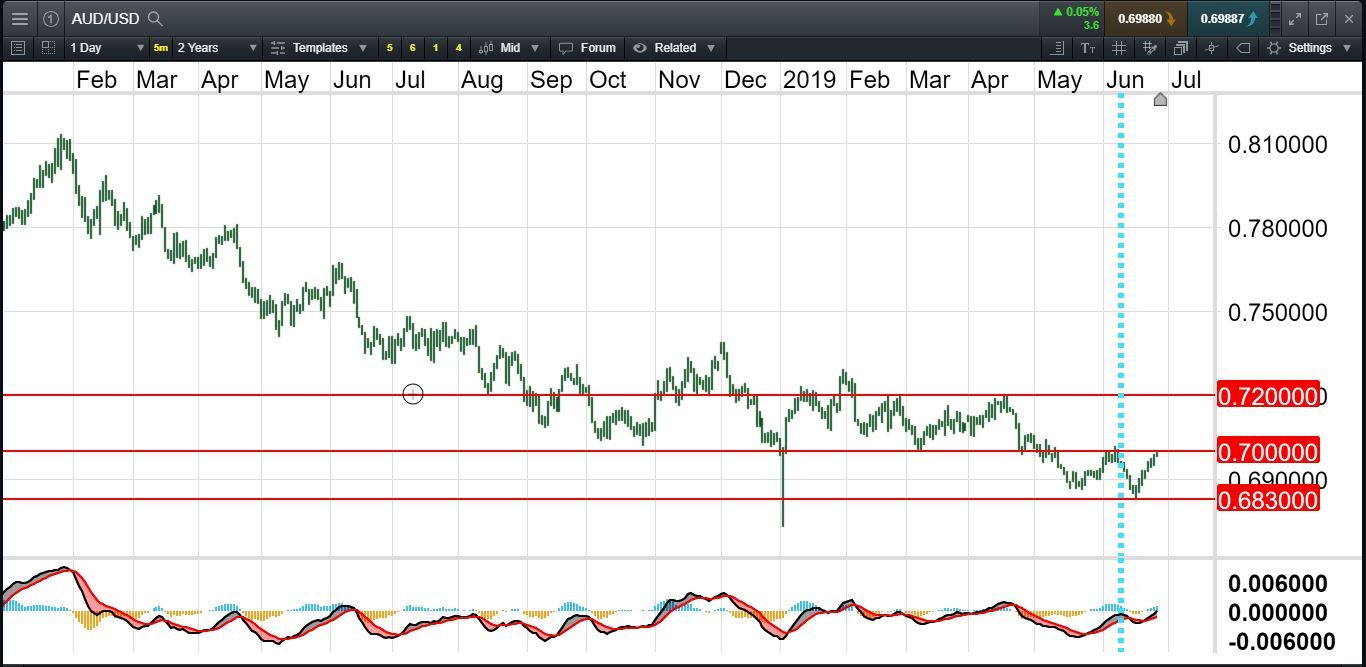
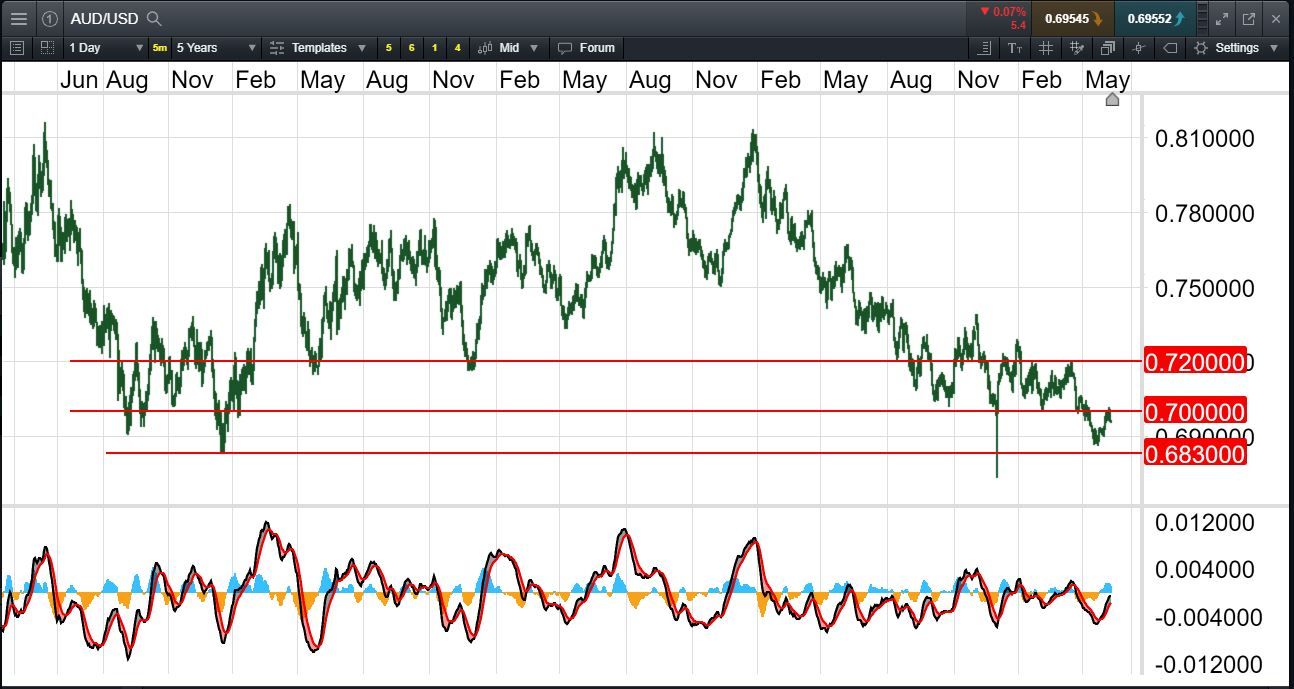
This daily chart shows three defined levels, at 0.6830, 0.7000 and 0.7200. The AUD/USD is sitting near the middle of the range, just below 0.7000. A break up through 0.7000 could see a test of 0.7200, in accord with a recently weaker USD. The MACD at the bottom of the shows positive momentum as both lines approach the zero threshold. Any upward break could see the momentum strengthen and the MACD cross the line, enhancing any buying bias.
However traders may see what they wish in a chart. Those bearish AUD/USD could see a selling opportunity on any approach to 0.7000, with a tight stop loss above.
However this is not necessarily a one trade chart. AUD/USD will trade the range between 0.6830 and 0.7200 until it breaks one or the other. There may be many buy and sell opportunities before that occurs.
Update 27 June:
the chart below shows how this unfolded. The blue line is the date of the original post. As stated at the time, this is not necessarily a one trade chart.


