The rally in US stocks is showing no signs of letting up, after all three major US indices recently closed at record highs.
The S&P 500 is currently trading above the 3,000 mark, after rallying by 3% since 1 October. It closed at an all-time-high of 3,078 on 4 November, while the Dow Jones Industrial Average inched to a new record-high of 27,49.63 on Tuesday.
Historically, the fourth quarter tends to be the strongest period for stocks. Over the past decade, November has often been among the best months of the year for the market.
The S&P 500, Nasdaq and Dow Jones have traded positively 80% of the time in November since 2009, according to an analysis by CNBC of data from Kensho, a hedge fund market analytics tool.
80%
Positive November performance for major US indices since 2009
The surge higher in stocks, which has been building up from the lows reached during the December 2018 sell-off, has given beaten-down value stocks a chance to shine, as investors move away from momentum to defensive stocks.
Healthcare stood out as the best-performing sector early this week, as earnings beats from Pfizer [PFE], Merck [MRK] and HCA Healthcare [HCA] lifted the sector. Consumer staples and real estate stocks also outperformed.
Growth stocks show weakness
Yet some investors think the record stock levels are looking shaky, as growth in more cyclical sectors, such as tech, communication services and consumer discretionary, begin to show signs of weakness.
“The S&P 500 is back at all-time-highs. But with even greater defensive leadership, it may warrant investor caution with respect to a growth reacceleration,” Morgan Stanley’s US chief equity strategist Mike Wilson wrote in a note to clients on Monday.
“The S&P 500 is back at all-time-highs. But with even greater defensive leadership, it may warrant investor caution with respect to a growth reacceleration” - Morgan Stanley’s US chief equity strategist Mike Wilson
It may be too soon to interpret value stocks’ recent outperformance as a sign that the economic and earnings slowdowns are coming to an end, Wilson added.
Indeed, much-loved FAANG stocks were all in the red on Tuesday. Amazon [AMZN] and Google parent company Alphabet [GOOG] took a nosedive after both reported disappointing Q3 earnings results that missed analysts’ estimates.
“People had aggressively pushed cyclicals higher over the past two weeks,” said Tom Essaye, founder of the Sevens Report, in an interview with CNBC. “But in order for that to work out beyond the short-term, we need to see economic data get better, and that’s not really happening.”
Stock market déjà vu?
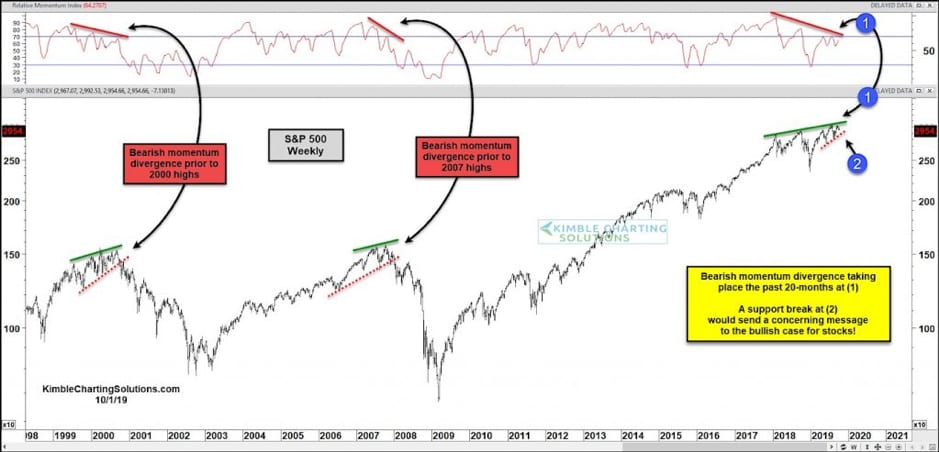
Investors could be seeing stock market déjà vu, according to Chris Kimble, the founder and CEO of Kimble Charting Solutions. More specifically, he said, there’s a key stock market indicator that is now sending a cautionary message to investors, which was seen back in 2000 and 2007.
In the chart below, Kimble takes a long-term look at the S&P 500 compared to its relative momentum.

“This is a classic bearish market divergence,” Kimble explains. But while momentum divergences are difficult to time, he urges that it’s important to be aware of them.
“Why? One reason is that similar momentum divergences produced the 2000 and 2007 highs and bear markets that followed,” he said.
“From a technical perspective, stock bulls will go from aware to concerned if price support breaks [at point 2].”
Disclaimer Past performance is not a reliable indicator of future results.
CMC Markets is an execution-only service provider. The material (whether or not it states any opinions) is for general information purposes only, and does not take into account your personal circumstances or objectives. Nothing in this material is (or should be considered to be) financial, investment or other advice on which reliance should be placed. No opinion given in the material constitutes a recommendation by CMC Markets or the author that any particular investment, security, transaction or investment strategy is suitable for any specific person.
The material has not been prepared in accordance with legal requirements designed to promote the independence of investment research. Although we are not specifically prevented from dealing before providing this material, we do not seek to take advantage of the material prior to its dissemination.
CMC Markets does not endorse or offer opinion on the trading strategies used by the author. Their trading strategies do not guarantee any return and CMC Markets shall not be held responsible for any loss that you may incur, either directly or indirectly, arising from any investment based on any information contained herein.
*Tax treatment depends on individual circumstances and can change or may differ in a jurisdiction other than the UK.
Continue reading for FREE
- Includes free newsletter updates, unsubscribe anytime. Privacy policy


