Below, Mish Schneider, director of trading research and education at MarketGauge.com, outlines some of the key support levels for ETFs charting the biggest indices in the US markets.
Wednesday was a pivotal day for the market.
With a gap down in the major indices, the market continued to sell-off until finding some late-day support, especially in the Dow Jones Index, which closed green.
A key to what happens from here over the next few days could be decided today.
Citigroup came out and expressed they see a 10% correction adding to the worries of many traders. With frothy conditions, that is understandable.
On the other hand, today could see a higher market and we will likely also see a new round of buying.
Luckily, by looking at the technical of the major indices we can plan what to expect, and more importantly what to do if the market decides to head lower.
With that said, charting is not a crystal ball, but I believe it is the next best thing.

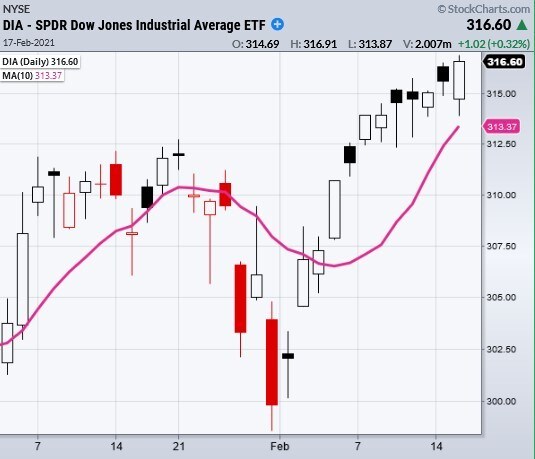
First, let us look at Wednesday’s index leader, the SPDR Dow Jones Industrial Average ETF [DIA], which was able to close at new all-time highs.
Even more, the DIA was the only major index to not break its 10-day moving average at $313.37.
When it comes to support, $211 is an important area to watch as there has been much consolidation from January there.

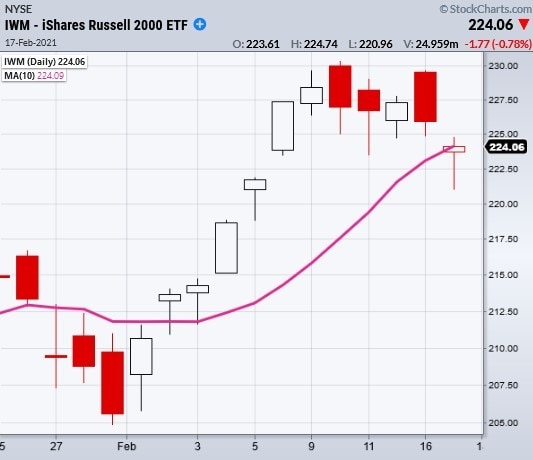
Next, we have the iShares Russell 2000 ETF [IWM], which closed just a single penny over its 10-DMA at $224.09.
Important support levels to watch are $222 and $214 area.
Technically, IWM had a potential topping pattern. Nonetheless, we have seen that type of pattern many times over the last few months and Wednesday’s volume did not indicate extreme fear.

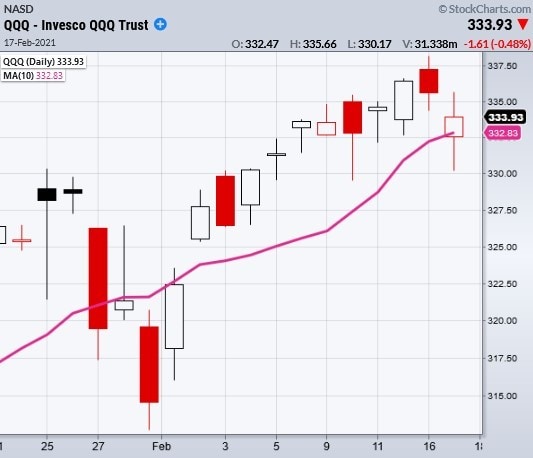
The Invesco QQQ ETF [QQQ] has the clearest support price to watch.
If you draw a line at $329.50 you can see multiple support points align on the chart.
This creates a pivotal area to watch for support to hold or break.
However, with the price currently back over its 10-DMA at $332.83, the highs are not far off.

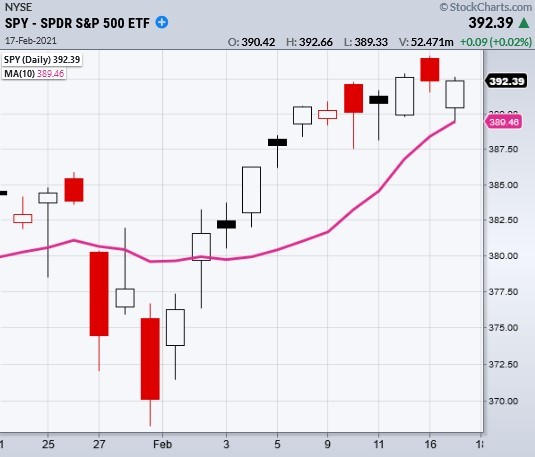
Lastly, we have good old SPDR S&P 500 ETF [SPY] holding the price range from the past couple weeks.
The most recent support comes in at $385, but like the rest of its index friends it is again holding over the 10-DMA at $389.47.
Technically, we have great levels to watch for the market to hold, but we also can’t forget that we have underlying support from the US Federal Reserve.
Yesterday, the Fed again announced that they will keep an accommodative stance. Yet for the first time a few members said that inflation could become a factor.
Perhaps even bigger than the Fed is the Biden administration considering not only stimulus, but also college loan cancellation and reparations for African Americans.
More printing, from the government or the Central Banks, will mostly like put more money in the hands of the Reddit and Clubhouse traders. With hearings on tap today, we will be closely tuned in.
Disclaimer Past performance is not a reliable indicator of future results.
CMC Markets is an execution-only service provider. The material (whether or not it states any opinions) is for general information purposes only, and does not take into account your personal circumstances or objectives. Nothing in this material is (or should be considered to be) financial, investment or other advice on which reliance should be placed. No opinion given in the material constitutes a recommendation by CMC Markets or the author that any particular investment, security, transaction or investment strategy is suitable for any specific person.
The material has not been prepared in accordance with legal requirements designed to promote the independence of investment research. Although we are not specifically prevented from dealing before providing this material, we do not seek to take advantage of the material prior to its dissemination.
CMC Markets does not endorse or offer opinion on the trading strategies used by the author. Their trading strategies do not guarantee any return and CMC Markets shall not be held responsible for any loss that you may incur, either directly or indirectly, arising from any investment based on any information contained herein.
*Tax treatment depends on individual circumstances and can change or may differ in a jurisdiction other than the UK.
Continue reading for FREE
- Includes free newsletter updates, unsubscribe anytime. Privacy policy


