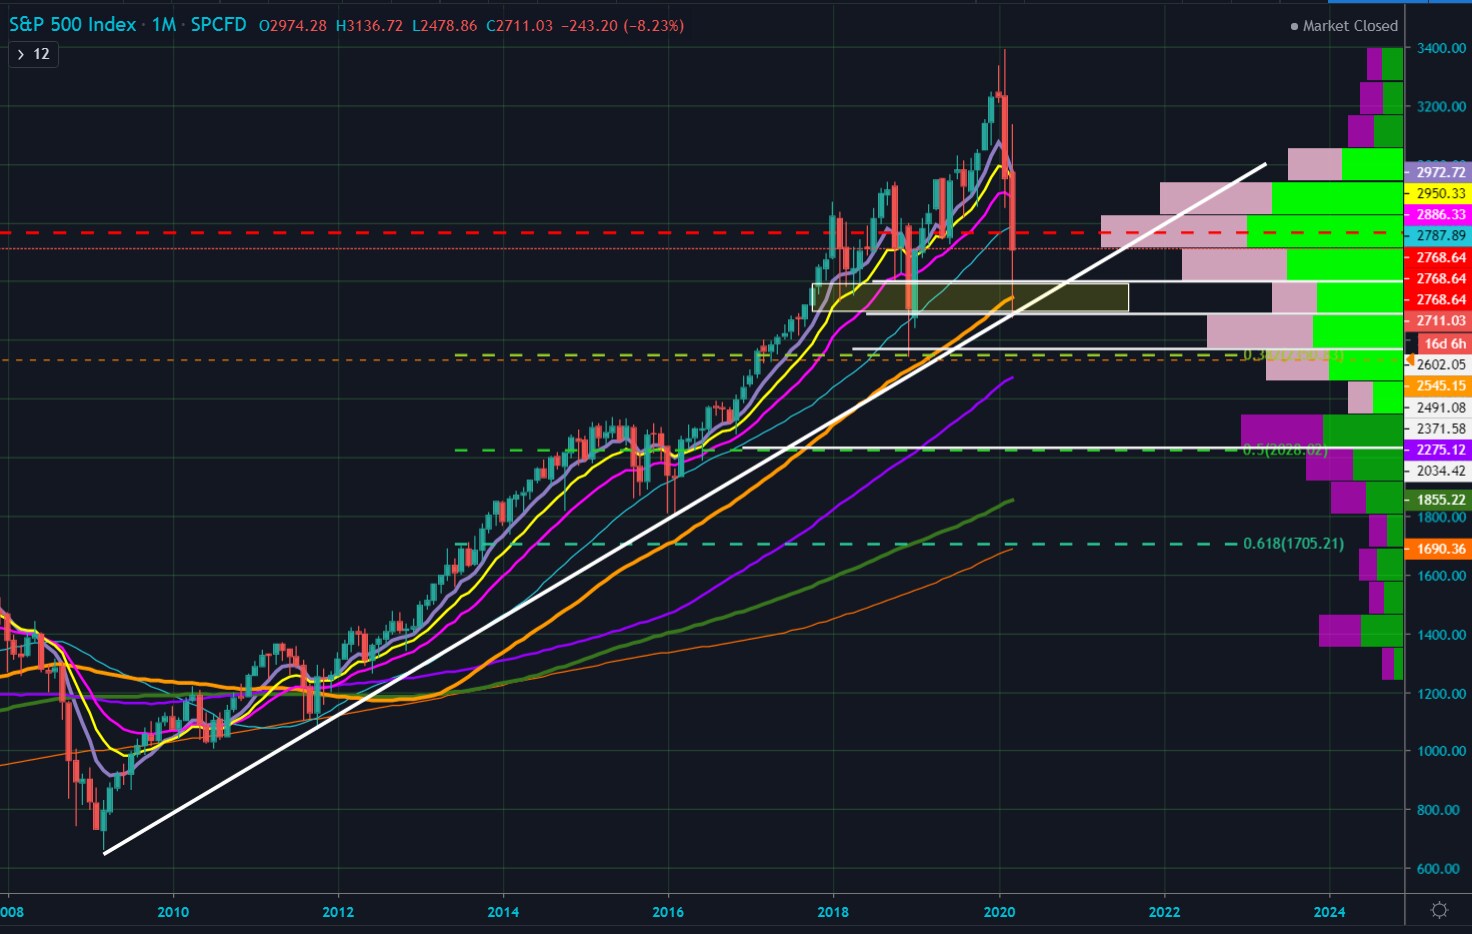
The recent move to a bear market from a new high set a record in terms of velocity of 21 days. While history of other sharp corrections may not be directly comparable, it is the best we have to work with considering history tends to repeat itself. Looking at bear markets over the last ninety years there are similarities as well as averages and medians to look at. These include median peak to trough price declines of 30%, P/E compression to 12X from 18X, average length of around 18 months and an average of 1100 trading days to recover bear market losses. Finally, the market peak tends to precede an economic recession by three quarters with average EPS declines of 20%.
The new environment calls for a new approach and a playbook from the one used the last few years. The volatile environment — using history as a guide — tends to last at least another three months. The 25 bear markets since 1929 saw corrections continue for 85 days on average following the 20% bear market threshold trigger. A large unwind has seen outflows from risky assets and inflows to safer assets.
The S&P 500
From a technical perspective the S&P 500 held its post-2009 trend level right to the point as well as the Q4 2018 high volume zone and closed above a 50% retracement of the 2016–2020 range. There is a concerning negative relative strength index divergence and in focus now are the March lows, the December 2018 lows, and then potential to retrace all the way back to the 2016 breakout zone of 2000/2150.

From an overall market valuation standpoint, we can use historical levels and weighted probabilities to find an attractive valuation bottom. A weighted outcome gives 1920 as a trough valuation for the S&P 500.

Considering the approach
High quality stocks have tended to outperform in higher volatility environments, those being companies with more stable earnings, and the best place to utilize the strategies to be outlined below. From a sector approach, defensive areas like Healthcare, Consumer Staples and Utilities are a focus.
The technical and fundamental outlooks continue to suggest waiting for a further correction to become more aggressive if seeking fundamental values. I also would note that the current volatility environment has been exacerbated by a record lack of liquidity in the options market due to uncertainty. Until that is corrected it makes it difficult on both the entry and exit side of trades to get desirable fills resulting in slippage that weighs on overall returns, so it is best to be patient and wait for a more optimal trading environment.
With that said, a few option strategies to consider during periods of heightened volatility include:
Put sales or bullish risk reversals
Although naked put sales are seen as dangerous — and rightfully so if using cash-secured put sales, meaning having capital to be put the shares — it allows you to not only define the exact point at which you are willing to buy shares of a company you are eyeing, but also benefit from the elevated premiums. The current environment has resulted in very steep implied volatility skews across individual stocks, so the tails are showing very heightened premiums. Considering the historical volatile environment sticking around it makes sense to look at expirations 6–12 months out that will also benefit as volatility eventually comes back in.
“Considering the historical volatile environment sticking around it makes sense to look at expirations 6–12 months out that will also benefit as volatility eventually comes back in”
As a basic example, Apple [AAPL] is trading at $278 [now $246] and September $200 puts are pricing $12 meaning a sale of these puts results in a $188 cost-basis on Apple shares. This is 32% [23% based on 18 March price] lower than the current price and puts shares at 16X FY20 earnings even if there is a 15% reduction to the current consensus EPS. It also puts shares just below a 50% retracement of the 2013/2020 range in shares. Rather than buying shares at current levels you can define a level that is way below the current while taking in a hefty premium and having a large cushion if conditions were to worsen.
Now, a more leveraged bullish position would combine the put sale with an upside call buy, and desirable to still be done at a net credit, while allowing the investor to participate in any upside move in shares beyond the credit received. The strategy can also be converted into “covered” risk reversals utilizing vertical spreads. An example would be also owning Apple September $325/$350 call spreads at a $5 debit, resulting in a total credit on the spread of $7, and gives potential to turn a net credit into a larger gain if shares were to rally back to recent highs.
Bull put spreads
This strategy is a less risky than the aforementioned as it defines exactly the potential risk. The current steep skew structure of a number of names makes the net credit on these spreads less ideal and would want to focus on names with flatter skews.
An example would be Alibaba [BABA] which has held up well with China being able to quickly recover from a temporary economic shock. The volume profile and trend support show $165 as a key level for shares to defend. The June $165/$160 bull put spread can be opened for a credit of $1.20, the risk being $3.80, but still attractive when looking at probabilities of expiring. The strategy gives around a 20% buffer in shares before turning into a loss.
These bull put spread strategies can also be combined with bear call spreads to enter into Iron Condors on an expectation that markets will remain choppy, where upside will also be limited until uncertainty clears — history shows it will be a while before markets can regain a solid footing. Iron Condors can be legged into selling the call spread side into sharp bear market rallies and selling the put spread side into panic moves.
Bear put spreads
For names that rebound into resistance and remain firmly in downtrends and see plenty of earnings risk, spreads are a valuable approach with this steep skew environment resulting in better reward/risk on the strategy and helps mitigate the high cost of put options.
An example is Disney [DIS], which has a 30-day IV Skew of +20% comparing to a +1.5 52-week average. Disney will face a number of headwinds with Cable, Theme Parks and Film all directly exposed to the COVID-19 impact, and on historical valuations and potential EPS declines plausible for shares to return to $70. The Disney May $95 puts cost $10, requiring shares to be 20.7% lower in two months to just break even. Meanwhile, the May $100/$90 put spread at $3.20 requires just a 5.65% lower to hit break even. It is clear to see that spreads are optimal in the current environment.
A more advanced trader could look at structuring ratio put spreads, if willing to be long shares at a certain price, or butterfly spreads to further take advantage of the current volatility structures.
“A more advanced trader could look at structuring ratio put spreads, if willing to be long shares at a certain price, or butterfly spreads to further take advantage of the current volatility structures”
Conditions in question
Between the high volatility and low liquidity while technical and fundamental analysis point to plenty of room for further downside, it is a market that is not ideal for straight call buys or put buys, nor does it feel safe to sell or buy volatility in strangle or straddle trades. It is important to understand volatility skew and the volatility surface and structure for this environment as well as to create optimal risk and reward strategies via spreads. It is also important to focus more on liquid large caps and quality fundamentals. Hopefully the above examples better prepare you for the months ahead in the market.
Disclaimer Past performance is not a reliable indicator of future results.
CMC Markets is an execution-only service provider. The material (whether or not it states any opinions) is for general information purposes only, and does not take into account your personal circumstances or objectives. Nothing in this material is (or should be considered to be) financial, investment or other advice on which reliance should be placed. No opinion given in the material constitutes a recommendation by CMC Markets or the author that any particular investment, security, transaction or investment strategy is suitable for any specific person.
The material has not been prepared in accordance with legal requirements designed to promote the independence of investment research. Although we are not specifically prevented from dealing before providing this material, we do not seek to take advantage of the material prior to its dissemination.
CMC Markets does not endorse or offer opinion on the trading strategies used by the author. Their trading strategies do not guarantee any return and CMC Markets shall not be held responsible for any loss that you may incur, either directly or indirectly, arising from any investment based on any information contained herein.
*Tax treatment depends on individual circumstances and can change or may differ in a jurisdiction other than the UK.
Continue reading for FREE
- Includes free newsletter updates, unsubscribe anytime. Privacy policy


