


The recent higher magnitude of uptick seen in the longer-dated US treasury yields over their shorter-duration counterparts over the past four weeks has ignited a rotation into cyclical/value sectors and away from technology and growth-oriented stocks such as Apple, Microsoft, Tesla and NVIDIA, which outperformed in the later part of Q4 2021, hitting fresh all-time highs.
The spread between the US 10-year treasury yield over the 2-year treasury yield has risen steadily from its 28 December 2021 low of 0.73% to 0.85% on 11 January that has sparked the recent rally of +5% to +13% seen in the financials, banks, energy sectors (cyclicals/value), while the information technology sector underperformed, with a decline of -4% over a same period.
Financials, banks & energy stocks outperform IT

Next up, we will be doing a combination of short to medium-term absolute and relative momentum analysis of the 11 US S&P sectors and ranked them according to their respective adjusted combined weightage average momentum scores (the highest value will be ranked higher). Let’ us first define the components of the momentum ranking system as follow;
Short-term absolute momentum = 5-day rate of change of individual sector
Medium-term absolute momentum = 20-day rate of change of individual sector
Relative Short-term momentum = 5-day rate of change of individual sector over S&P 500
Relative Medium-term momentum = 20-day rate of change of individual sector over S&P 500
Combined weighted average momentum = using equal weights to sum the average of the short to medium-term absolute momentum values & the average of the short to medium-term relative momentum values.
Adjusted combined weightage average momentum = normalised the combined weighted average momentum values according to the respective sectors’ 10-day average true range so that we can have a better comparison as different instruments will have significantly different range of prices; for example, a $10 stock vs. $100 stock.
Based on the closing prices of 11 January 2021, the top three highest ranking sectors (that have the highest values based on their respective adjusted combined weightage average momentum) are Energy, Financials and Consumer Staples which implies bullishness while the bottom three are Real Estate, Utilities and Information Technology.
Energy, financials & consumer staples are ranked the highest according to combined momentum analysis.

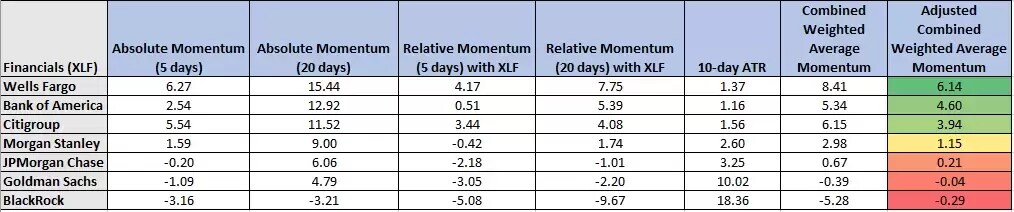
Since the financials sector is one the of top ranked in terms of combined momentum, we can also use a similar approach to rank the individual financials/banking stocks within the Financials sector according to their respective absolute and relative momentum values (comparing the rate of change of the stock over its respective inherent sector for relative momentum) and it may add some colour in our technical analysis as several major US financials report their respective Q4 2021 earnings results this Friday, 14 January (BlackRock, Citigroup, JPMorgan Chase & Wells Fargo and the following week).
Based on the closing prices of 11 January 2021, Wells Fargo, Bank of America and Citigroup are ranked the highest according to their respective adjusted combined weightage average momentum values.

By using the combined momentum ranking system, we can filter out stocks or any instruments and select those stocks or instruments that have the highest or lowest combined momentum values in terms of both upside and downside momentum which in turn can be used to formulate robust trading strategies in conjunction with other forms of technical analysis such as overbought and oversold conditions.

Find your flow: four principles for trading in the zone
Learn about the four trading principles of preparation, psychology, strategy, and intuition, and gain key trading insights from some of the world's top investors.
Get this free report
Disclaimer: CMC Markets is an execution-only service provider. The material (whether or not it states any opinions) is for general information purposes only, and does not take into account your personal circumstances or objectives. Nothing in this material is (or should be considered to be) financial, investment or other advice on which reliance should be placed. No opinion given in the material constitutes a recommendation by CMC Markets or the author that any particular investment, security, transaction or investment strategy is suitable for any specific person. The material has not been prepared in accordance with legal requirements designed to promote the independence of investment research. Although we are not specifically prevented from dealing before providing this material, we do not seek to take advantage of the material prior to its dissemination.

