The big picture for world stock market indices remains largely unchanged this week, with US indices heading towards the “lagging” quadrant (the bottom-left corner of the below chart), putting them in a relative downtrend versus the benchmark MSCI world index. Meanwhile, most other markets are moving in the opposite direction, heading towards the “leading” quadrant in the top-right corner.
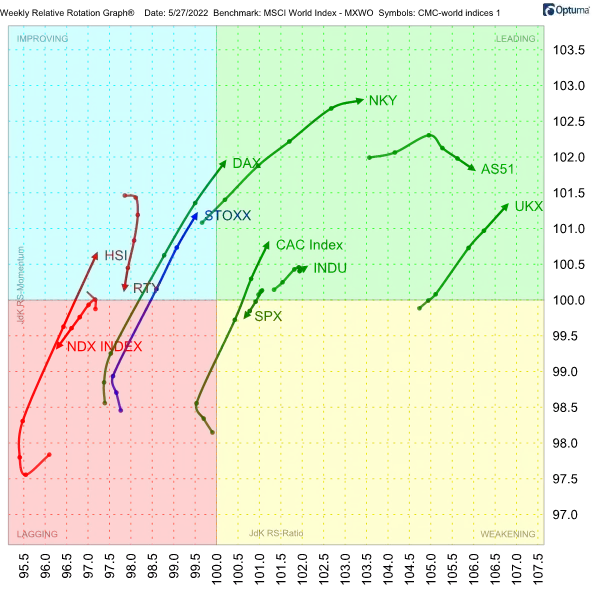
European markets, including France’s CAC, Germany’s DAX, the FTSE 100 [UKX] and the Europe-wide STOXX index, remain in relative uptrends. Also enjoying continued relative strength are Japan’s Nikkei index [NKY] and Australia’s ASX 200 [AS51].
The Russell 2000 index [RTY] is displaying a noticeably weak rotation, from the upper-left “improving” quadrant towards the bottom-left “lagging” quadrant.
Are US markets poised for a bounce?
On the daily Relative Rotation Graph (RRG) below, the picture is more or less flipped. RTY, rotating in a negative direction on the weekly RRG above, is moving in a positive direction on the daily chart below, which was compiled on 26 May. At the same time, the European markets that were heading in a positive direction on the weekly chart are rotating towards the bottom-left corner as of 26 May.
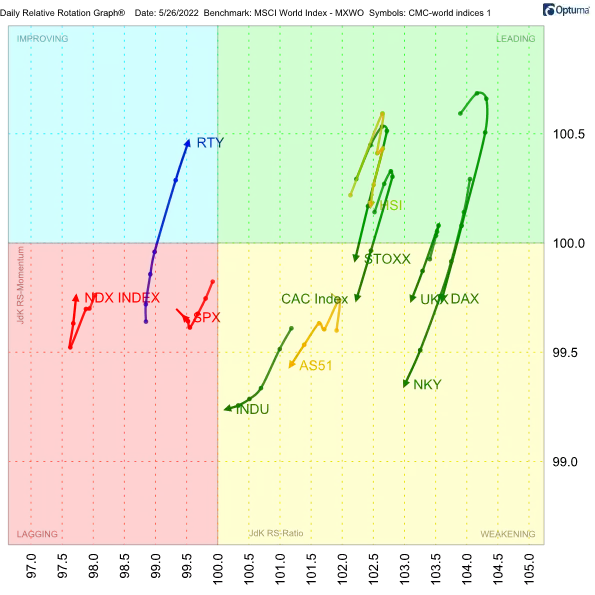
What does this tell us? In short, US markets are due a rebound. Because the US indices – RTY, SPX and NDX – are on the left of the graph and to the left of the majority of markets on the plot, and because all markets on the positive, right-hand side of the weekly chart are still on the right-hand side of this daily chart, the evidence suggests that US markets are making a temporary move against the dominant trend.
Zooming in on US markets
A closer look at the indices in question supports this view. First, the S&P 500 index is resting at an intermediate support level, having broken below an important support level a few weeks ago, as the below chart indicates. More serious support is only found in the area around 3,500.
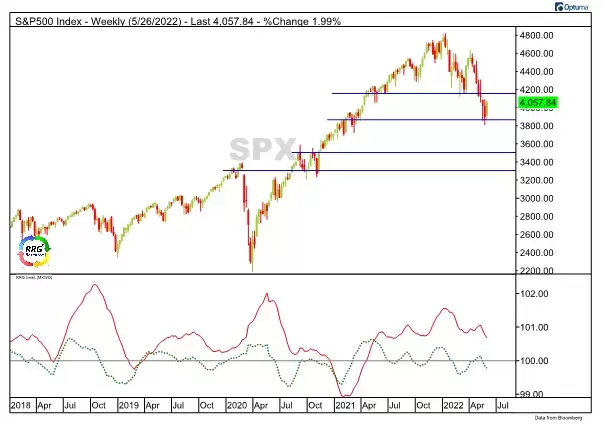
Our data indicate that the recent trend is on pause and a reversal may be imminent. Given the downtrend illustrated by the above chart, we would regard any rally out of the current lows as a bounce within the dominant trend.
It is quite possible that additional supply will come to the market once the S&P 500 climbs back towards the area around 4,100.
Moving on to the Russell 2000, we can see from the below chart that this index dropped further than the S&P 500, and is currently resting at a major support level offered by the peaks in 2018 and 2020. The relative strength of this index, as measured against the MSCI world index, is therefore even weaker than that of the S&P 500.
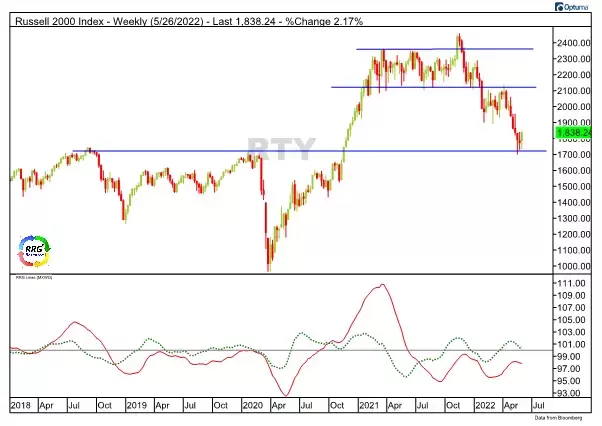
Our analysis also indicates that the index is now pushing against resistance created by last week’s peak. A break above that level will unlock upside potential towards the former horizontal support area around 1,940. We see this as a short-term, tradable move, but one that still sits within a longer term downtrend.
Energy stocks performing well
The current composition of our US Growth 1000 RRG Momentum+ share basket is shown in the RRG below. The heavy concentration of energy stocks in this basket makes it one of our better performing baskets in the current quarter.
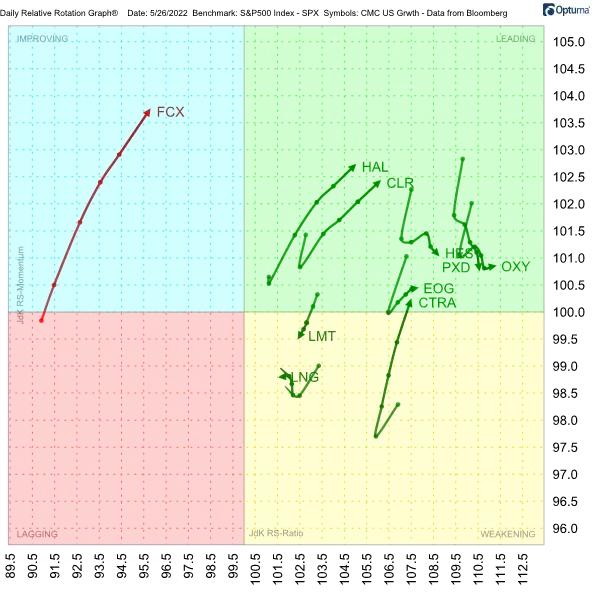
Companies in this chart that warrant a closer look include Coterra Energy [CTRA], Halliburton [HAL], and Freeport McMoran [FCX] inside the top-left “improving” quadrant.
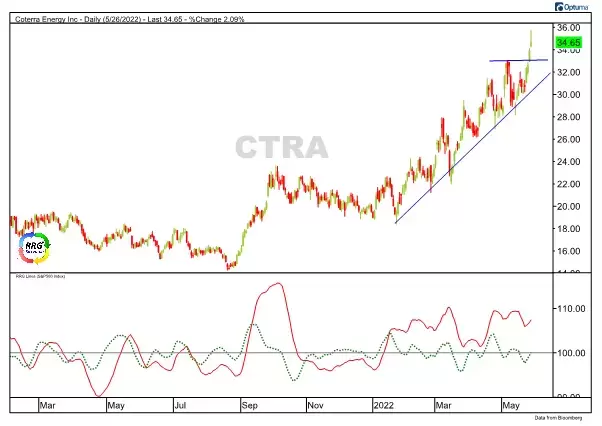
Starting with hydrocarbon exploration firm Coterra, this stock recently broke to new highs after a minor setback. It is now back in the uptrend that started at the beginning of the year. In the lower third of the below image, CTRA’s recent move is pushing the green line, which captures momentum, back above 100. On the above graph, CTRA’s tail is heading back towards the “leading” quadrant.
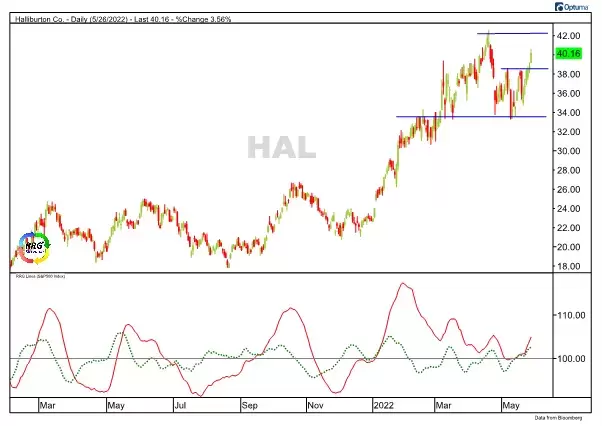
Second, oil, gas and fracking heavyweight Halliburton is not doing quite as well as CTRA, but recently managed to move out of the consolidation area between 34-38, as shown in the below chart. HAL is now on course to test overhead resistance at 42. With Both RRG-lines pushing further above 100, the outlook for HAL remains strong within the RTY universe.
Finally, mining company Freeport McMoran is starting to see an uptick after a sharp decline since March. As the chart below illustrates if the stock can hold at these price levels and improve further, we could see it rotate towards our “leading” quadrant.
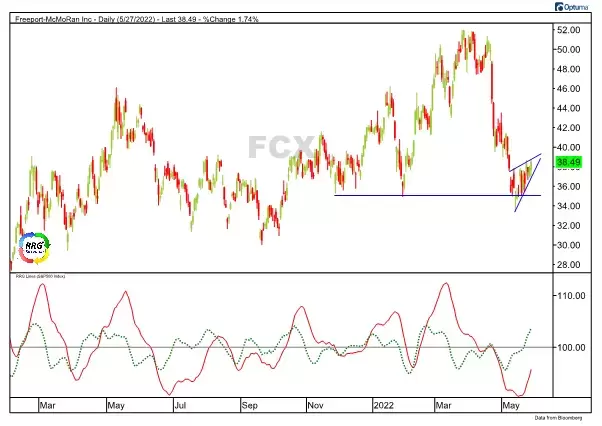
There is one caveat, however. The potential forming of a rising wedge, as marked in the chart above, is a notoriously weak price formation. In the event that it breaks down, it could herald a continuation of the prevailing trend and possibly even an acceleration lower.
That said, support from the November and January lows is being provided at the base of the formation, which could help mitigate downside risk.
Pricing is indicative. Past performance is not a reliable indicator of future results.
Disclaimer: CMC Markets is an execution-only service provider. The material (whether or not it states any opinions) is for general information purposes only, and does not take into account your personal circumstances or objectives. Nothing in this material is (or should be considered to be) financial, investment or other advice on which reliance should be placed. No opinion given in the material constitutes a recommendation by CMC Markets or the author that any particular investment, security, transaction or investment strategy is suitable for any specific person. The material has not been prepared in accordance with legal requirements designed to promote the independence of investment research. Although we are not specifically prevented from dealing before providing this material, we do not seek to take advantage of the material prior to its dissemination.


