Medium-term technical analysis (1 to 3 months)

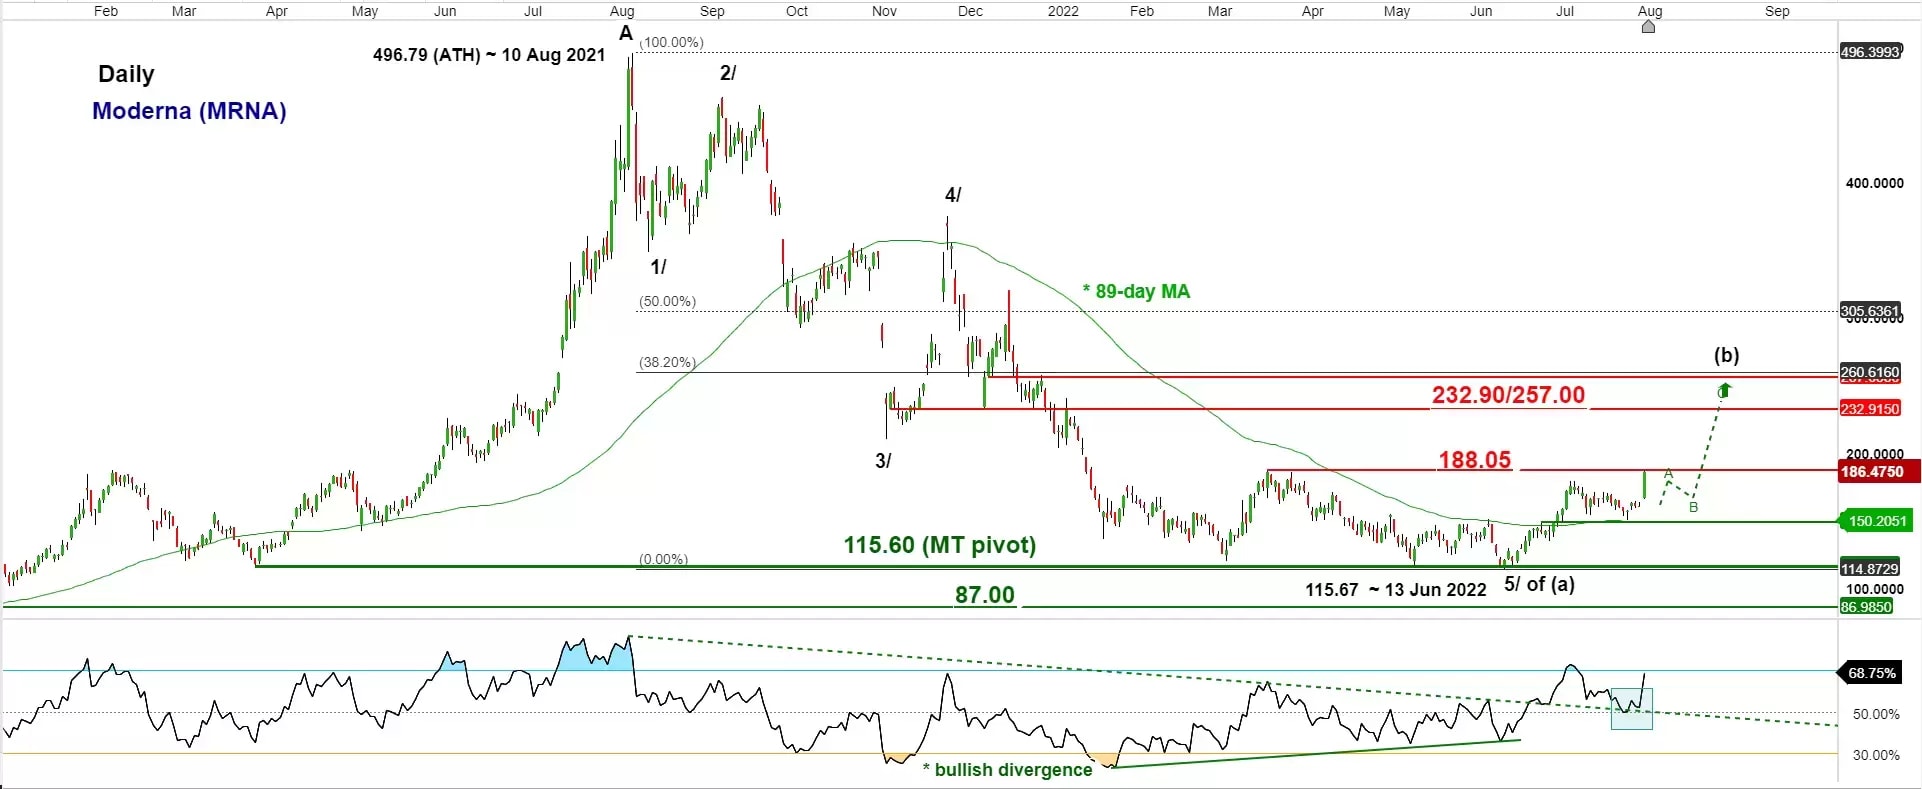
Integrated technical analysis (graphical, momentum, Elliot Wave/fractals) suggests that its major downtrend phase from its 10 August 2021 all-time high of 496.79 that plummeted by -77% to print an intraday low of 115.67 on 13 June 2022 may have reached an inflection level where a potential medium-term basing formation may take shape for Moderna to trigger a multi-month corrective rebound phase to retrace a portion of the major downtrend phase’s losses.
Key Levels (1-3 months/MRNA)
Intermediate support: 149.70
Pivot (key support): 115.60
Resistances: 188.05 & 232.90/257.00
Next supports: 87.00 & 57.45
Directional Bias (1-3 months/MRNA)
Watch the 115.60 key medium-term pivotal support and clearance with a daily close above 118.05 reinforces another leg of potential corrective rebound towards the next resistance zone of 232.90/257.00.
On the other hand, failure to hold at 115.60 with a daily close below it ignites another round of impulsive down move sequence towards the next supports at 87.00 & 57.45 (also swing low areas of 2 June/2 July/8 September 2020).
Key elements for Moderna's share price
- Elliot Wave/fractal analysis has indicated the completion of a major cycle down move sequence labelled as 1/, 2/, 3/, 4/, and 5/ since its 10 August 2021 all-time high of 496.79 which indicates a probable terminal point of this major cycle down move has been reached on 14 June 2022 (potential end of the major downtrend phase).
- The daily RSI oscillator has shaped a bullish breakout above its key corresponding descending resistance at the 50% level on 1 July 2022 and retested it recently on 28 July 2022. It has also shaped a prior bullish divergence signal at its oversold region on 13 June 2022. These observations suggest a revival of medium-term upside momentum.
- Price actions have surpassed the 89-day moving average that has capped prior recoveries in price actions since 30 November 2021. Also, the recent pull-back in price actions has managed to test and shaped a bounce off the 89-day moving average on 28 July 2022 now acting as intermediate support of 149.70.
- The 232.90/257.00 medium-term resistance zone is defined by the former swing low area of 5 November/10 December 2022 and the 38.2% Fibonacci retracement of the major downtrend phase from 10 August 2021 low to 13 June 2022 low.
Disclaimer: CMC Markets is an order execution-only service. The material (whether or not it states any opinions) is for general information purposes only, and does not take into account your personal circumstances or objectives. Nothing in this material is (or should be considered to be) financial, investment or other advice on which reliance should be placed. No opinion given in the material constitutes a recommendation by CMC Markets or the author that any particular investment, security, transaction or investment strategy is suitable for any specific person. The material has not been prepared in accordance with legal requirements designed to promote the independence of investment research. Although we are not specifically prevented from dealing before providing this material, we do not seek to take advantage of the material prior to its dissemination.


