This article is written by CMC APAC market analysts; Kelvin Wong, Tina Teng, Azeem Sheriff & Leon Li
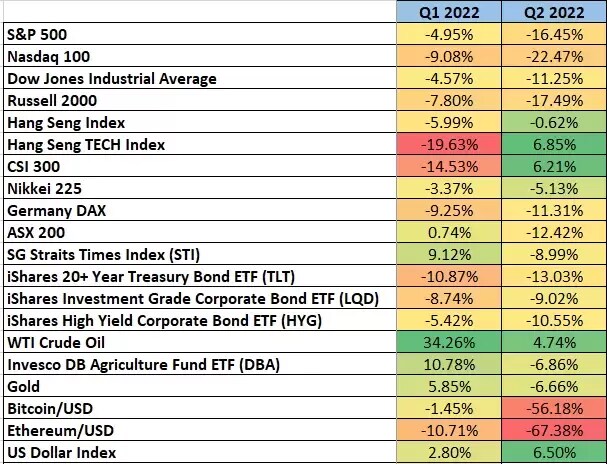
Risk assets such as equities (with exception of China), cryptocurrencies, and even fixed income that covers all spectrum from sovereign to high yield corporate bonds have ended the first half of 2022 on a downbeat tone (see table below).
Source: TradingView
The US S&P 500 has entered a bear market officially with a -21% decline from its January 2022 all-time high; ended the month of June with a loss of -8.4% and a -16.5% for Q2, its worst 3-month performance since Q1 2020.
In addition, the disappearance of diversification benefits from bonds in a widely used 60/40 portfolio strategic asset allocation (60% in equities & 40% in fixed income) has been attributed to more hawkish rhetoric and tighter monetary policies engineered by developed nations’ central banks led by the US Federal Reserve excluding Bank of Japan and People’s Bank of China as they are still having accommodating monetary policies.
Anticipation of a faster pace of interest rate hikes by the Fed has led to a rapid acceleration of long-term US Treasury yields such as the 10- and 30-years maturities which in turn put downside pressure on long-duration fixed income as bond prices and yields move inversely.
Also, a rapid increase in US 10-year Treasury yield hurts technology and growth-related equities as they are considered as “long-duration” due to more levered balance sheets to fund growth and business expansions; technology-heavy Nasdaq 100 and small caps centric Russell 2000 were the worst performers in H1 2022. An up-trending US 10-year Treasury yield after 30 years of secular downtrend implies a significant surge in the cost of funding (liquidity squeeze).
A linger of hope for risk assets and US equities in Q3 (reminder: it is just “hope”)
The main culprit that triggered the Fed to adopt a more hawkish stance on its monetary policy was due to elevated inflationary pressures that rose to a 40-year high where the bulk of it was caused by higher prices of energy and agriculture products.
An important point to note is that markets are always forward-looking and dynamic which means that the current negative sentiment was seen in risk assets and higher cost of funding via tighter monetary policies are likely to trigger a negative feedback loop in the real economy which in turn put downside pressure on aggregate demand on goods and services. Thereafter, lesser aggregate demand increases the odds of peak inflation but is not a certainty as supply-side factors remain murky; capacity constraints of oil-producing countries in OPEC, and the conflict between Russia and Ukraine.
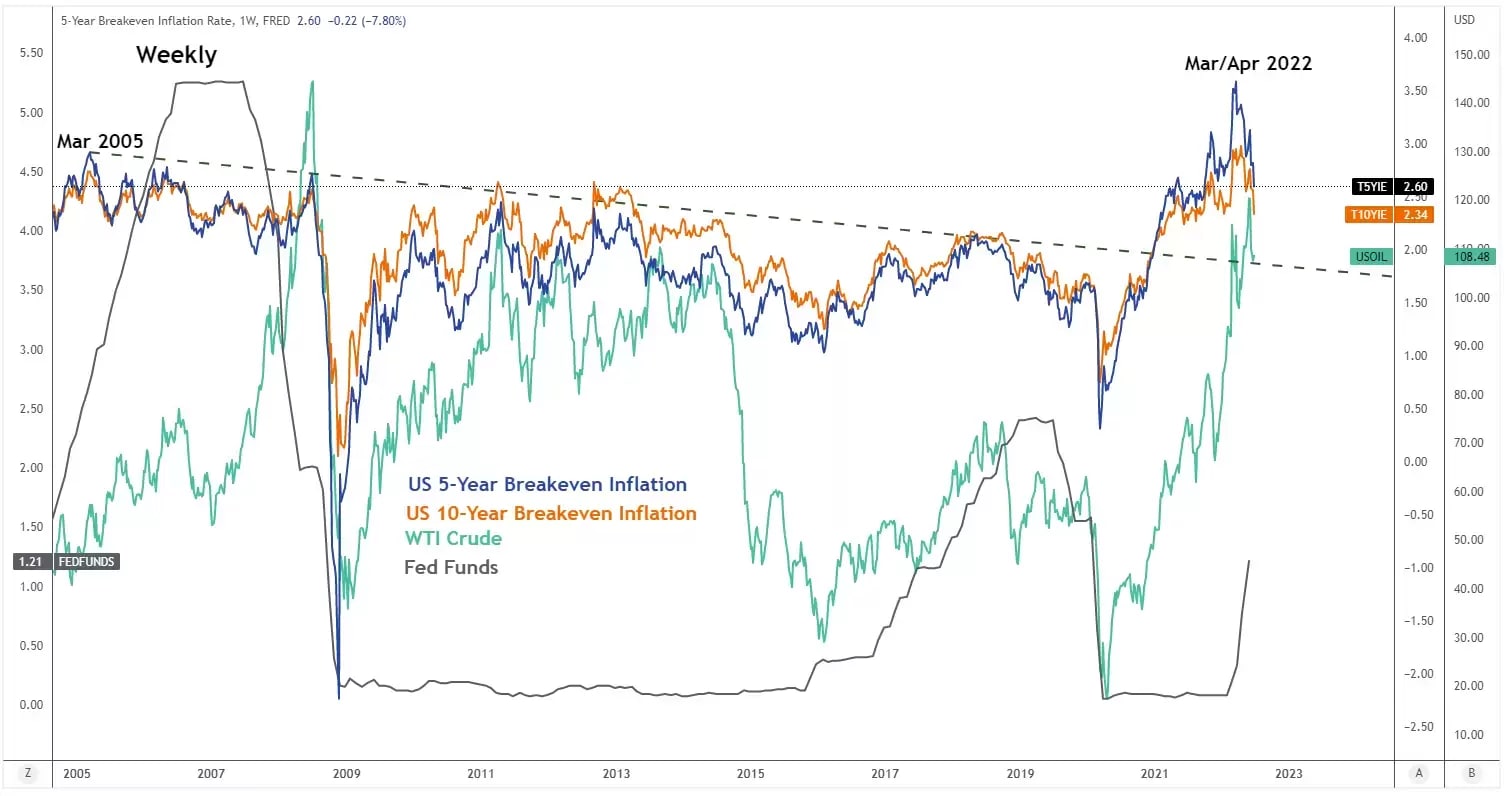
Forward-looking inflationary expectations in the US have started to cool down
Source: TradingView as of 4 Jul 2022
The US 5-year and 10-year breakeven rates (which measures what inflation is expected to be in the next 5 years and 10 years on average) derived via Treasury Inflation-Protected Securities have inched lower since 15 June FOMC; traded at 2.60% and 2.34% as of 1 July and both rates have been oscillating in a downward path since their March 2022 levels of 3.59% and 2.95%.
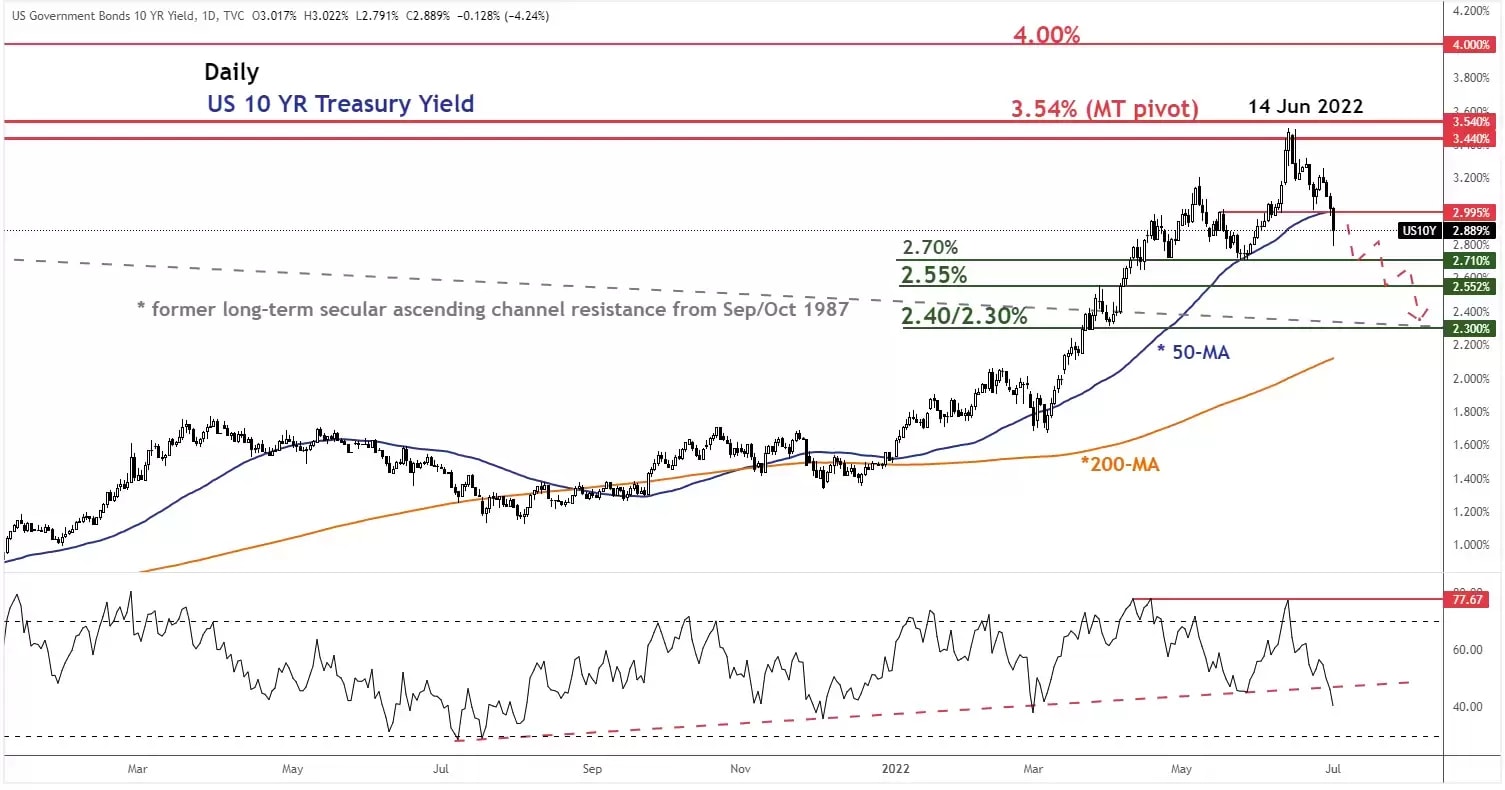
Also, the 10-year US Treasury yield has started to shape a pull-back after its recent up move that hit a key medium-term resistance zone of 3.44%/3.54% on 14 June 2022 coupled with a monthly loss of -8% seen in WTI crude oil in June after six consecutive months of positive performances. In addition, prices of agriculture products have turned soft where the Invesco DB Agriculture ETF (DBA) declined by -7.3% in June after it hit a 52-week high in May.
These forward-looking inflationary indicators suggest a narrative that the “Fed has managed to cool down future inflationary expectations based on its current hawkish guidance” is likely to gain traction in Q3 which in turn implies that the Fed may opt for a lower magnitude of interest rate increases over a 75 bps hike on the Fed funds rate in future FOMC meetings after July.
Thus, the negative feedback loop that spiralled into global equities in H1 2022 may pause to offer a corrective relief rebound in Q3 before another potential major downtrend phase materializes.
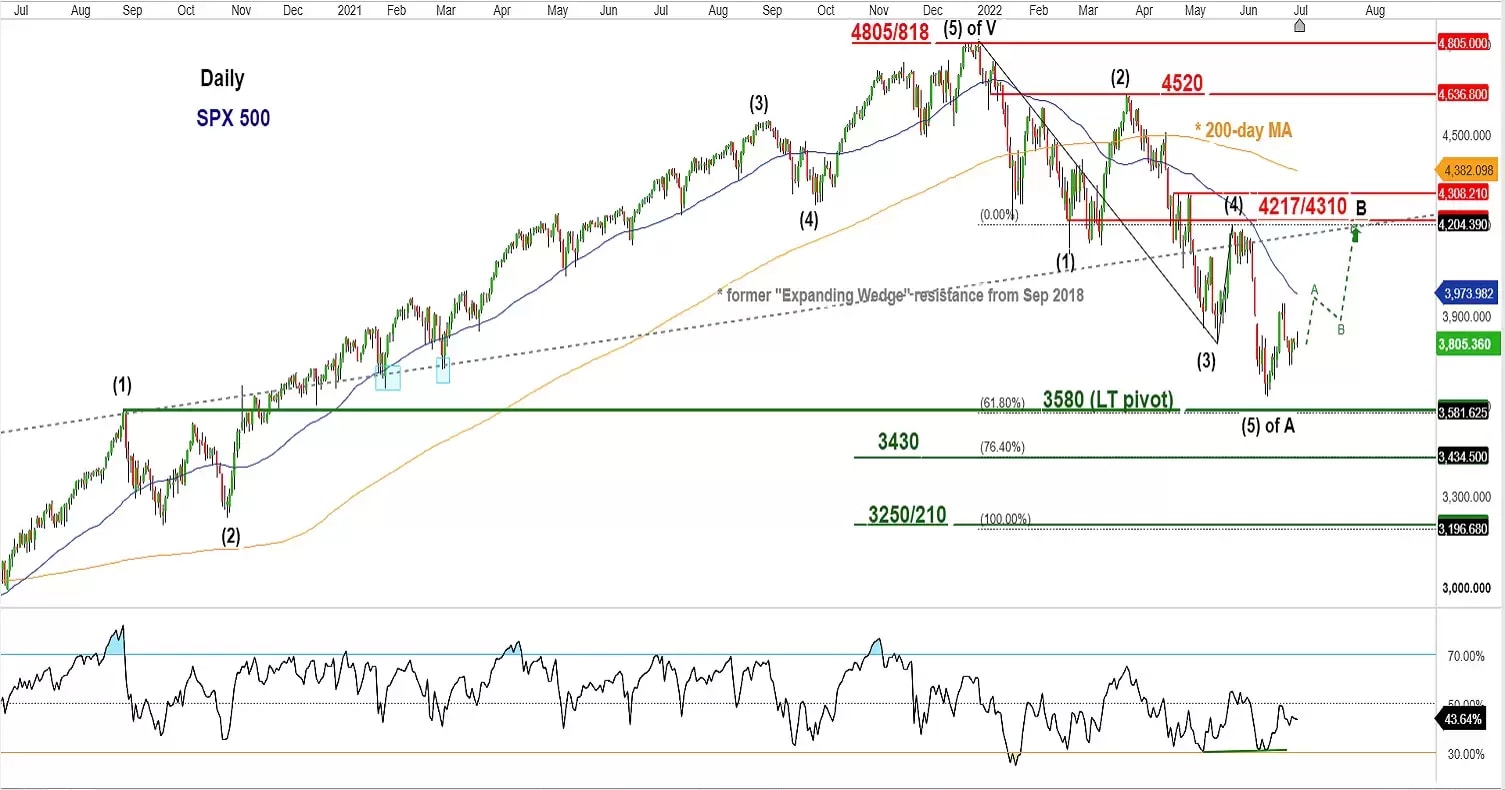
Watch the 3,580 key support on S&P 500
Source: CMC Markets as of 5 Jul 2022
Integrated technical analysis suggests the first leg of the major downtrend from its January 2022 all-tine high may have ended. If 3,580 holds, the S&P 500 is likely to shape a potential corrective rebound towards the 4,217/4,310 resistance zone. However, a weekly close below 3,580 invalidates the corrective rebound scenario for a continuation of the impulsive down move sequence towards the next supports at 3,430 and 3,250/3,210.
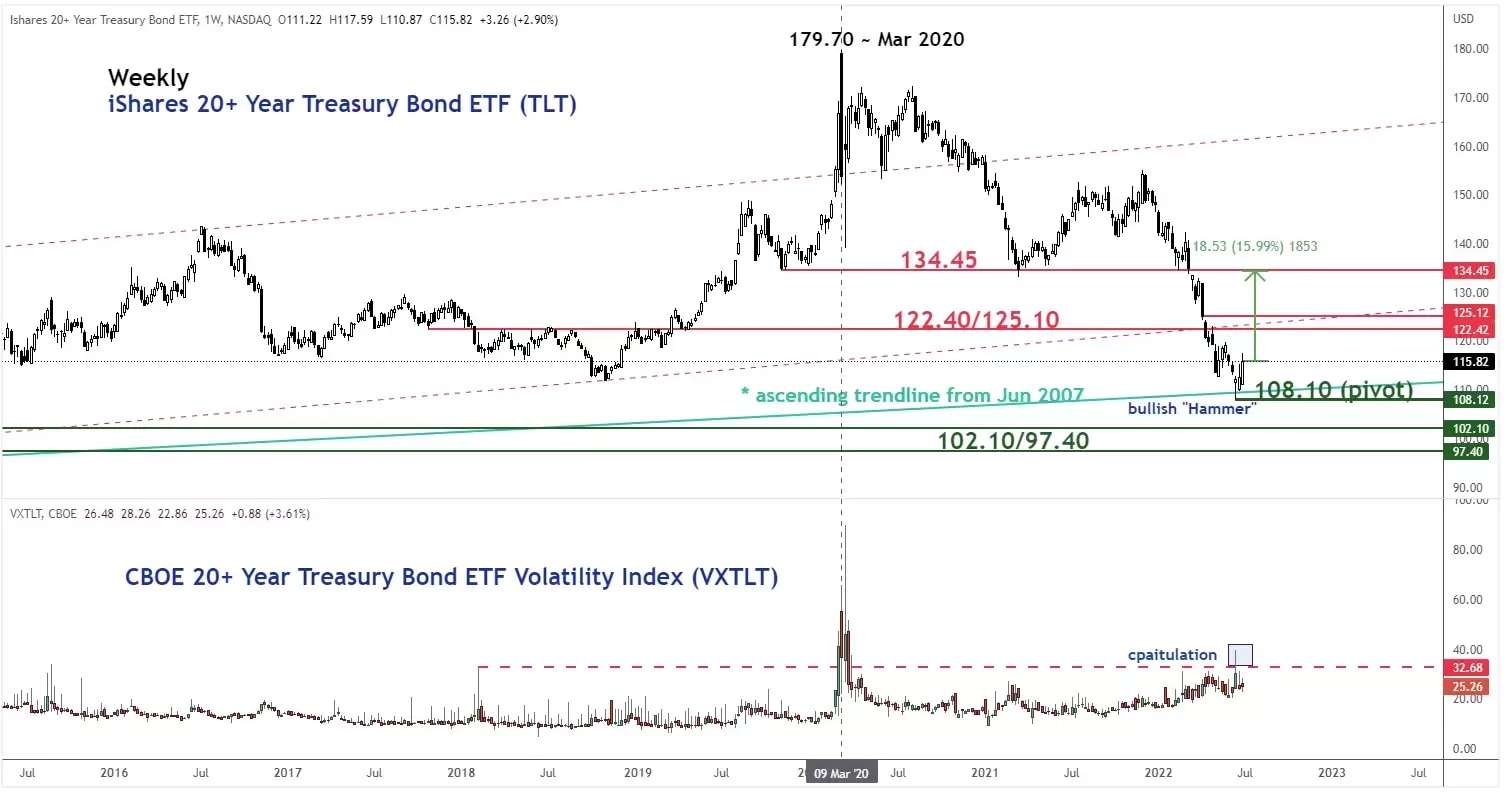
Long-duration Treasury bonds may see a relief tactical rebound in Q3
Source: TradingView as of 4 Jul 2022
Given that bond prices and bond yields move inversely, a potential medium-term pull-back/consolidation of the US Treasury 10-year yield towards the supports of 2.55% and 2.40%/2.30% with 3.54% as the key medium-term pivotal resistance may trigger a relief rebound in long-term US Treasury bonds that have recorded steep losses of -26% from the start of 2022.
Watch the key pivotal support of 108.10 on the iShares 20+ Year Treasury Bond ETF (TLT) to maintain the relief rebound scenario towards the 122.40/125.10 and 134.50 resistances. However, a weekly close below 108.10 invalidates the bullish tone for a further drop towards the next support at 102.10/97.40.
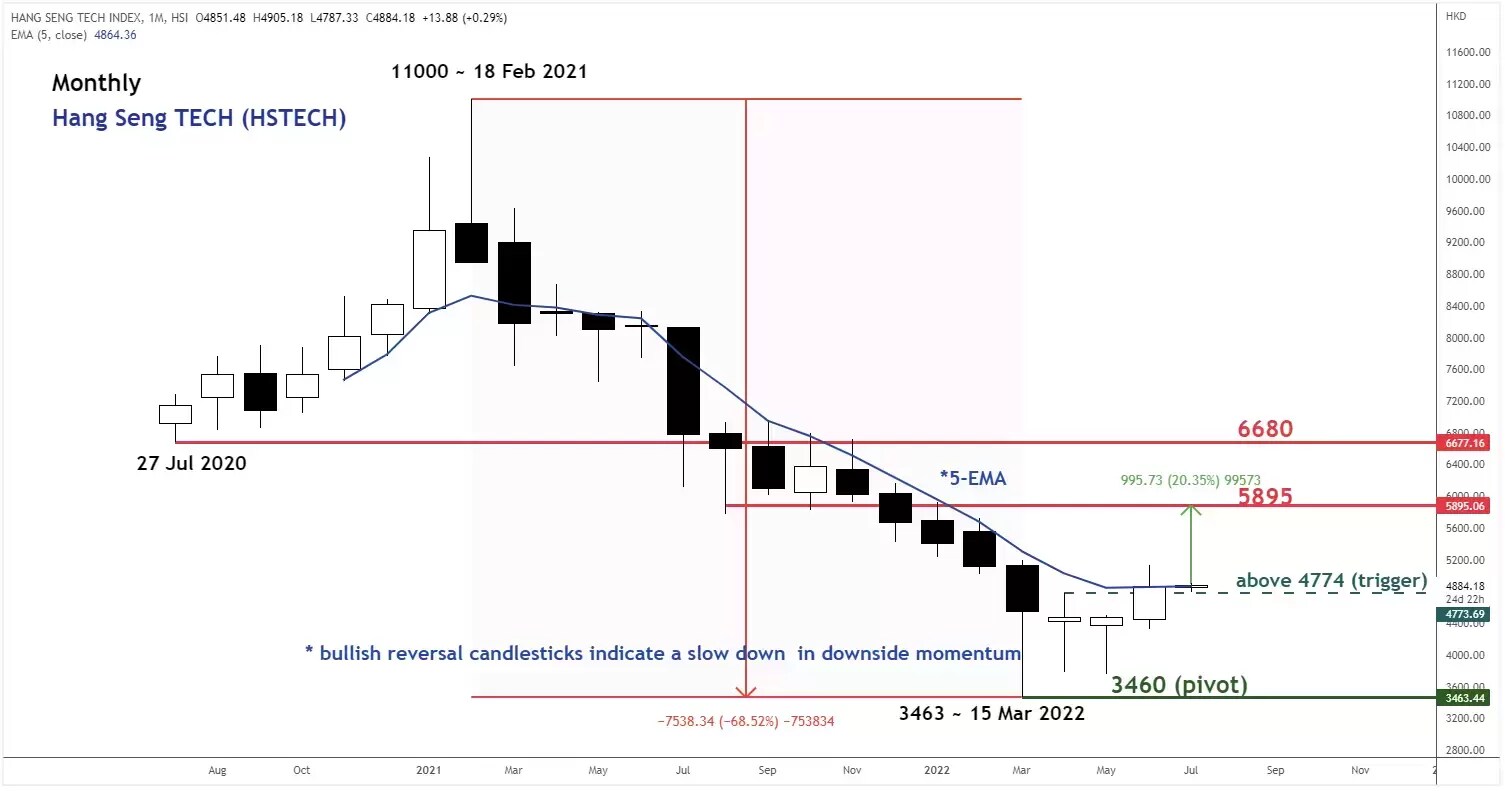
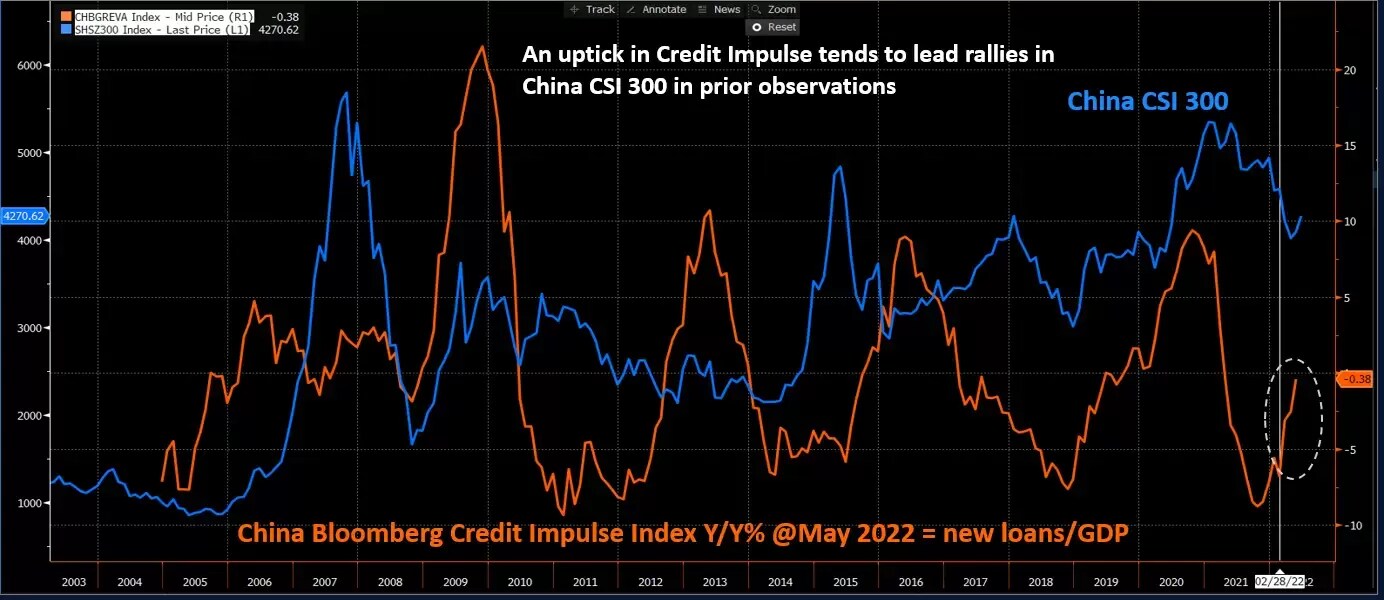
China equities may continue its upside momentum supported by an uptick in credit impulse
Source: TradingView as of 4 Jul 2022
Source: Bloomberg as of 22 Jun 2022
Hang Seng TECH Index, a barometer for China Big Tech equities such as Alibaba, Baidu, JD.com, Meituan, and Tencent has breached a key resistance of 4,774 with a monthly close above it in June that confluences with the 5-period exponential moving average that capped previous rallies since March 2021.
The China Bloomberg Credit Impulse, a gauge of new credit flows as a percentage of GDP has started to form an upswing based on the latest data for May. An improvement in credit impulse seen in prior periods tends to lead to significant rallies in the China stock market, using the China CSI 300 Index as the proxy.
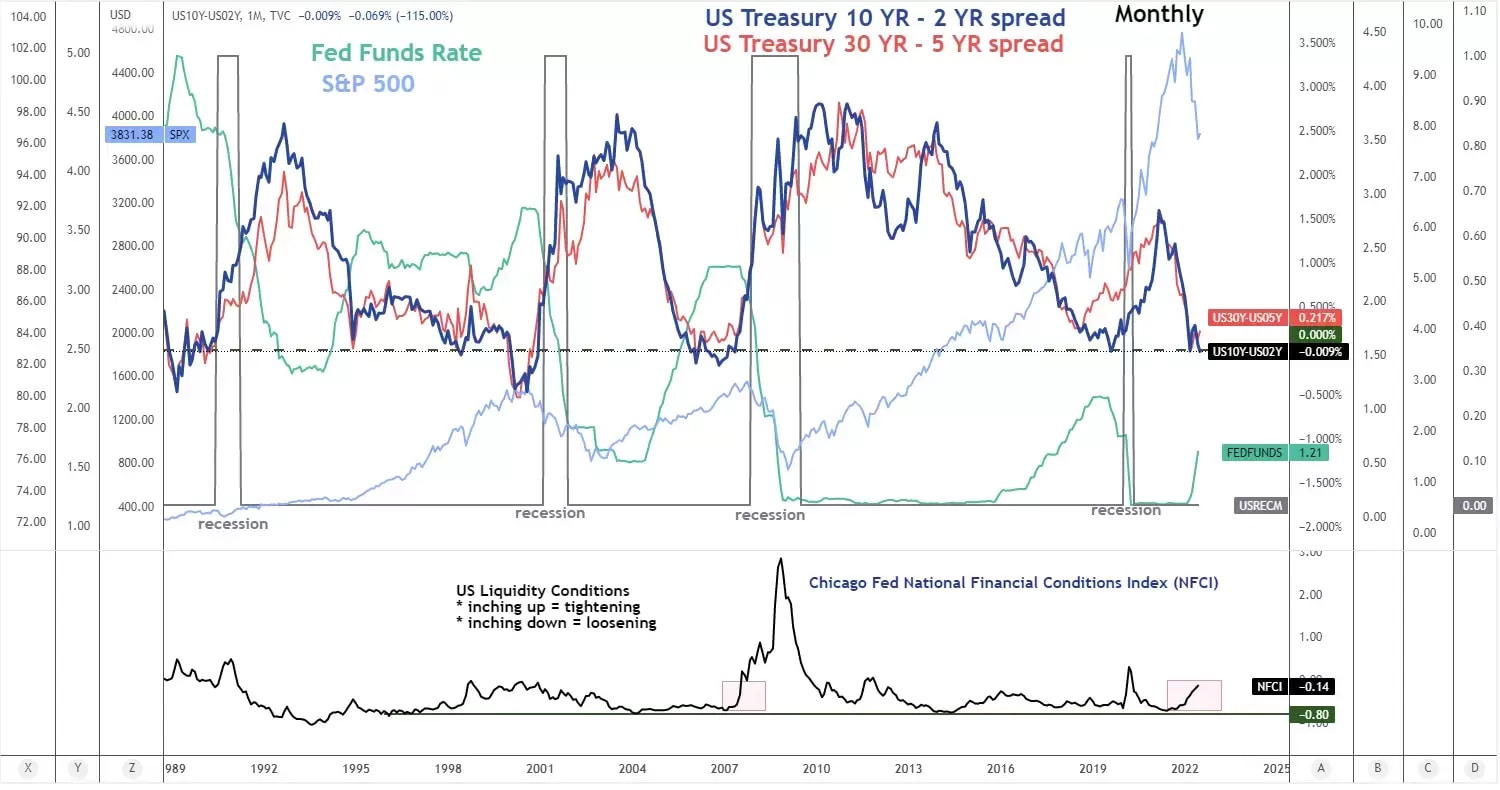
No clear signs to support a major bottoming process for risk assets and global equities
Source: TradingView as of 5 Jul 2022
Source: Bloomberg as of 22 Jun 2022
The major downtrend phases of the US Treasury yield spread for both the 10-year over 2-year and 30- year over 5-year in place since February 2021 are still intact and continued to be heading towards the trajectory of yield curve inversions (longer-term yields fall much faster than short-term yields) which increases the odds of an impending recession.
In addition, aggregate US liquidity conditions as measured by the Chicago Fed National Financial Conditions Index (NFCI) are still on an upward trajectory path (tightening) as it has surged by +80% from its June 2021 trough level and now coming close to its March 2020 peak.
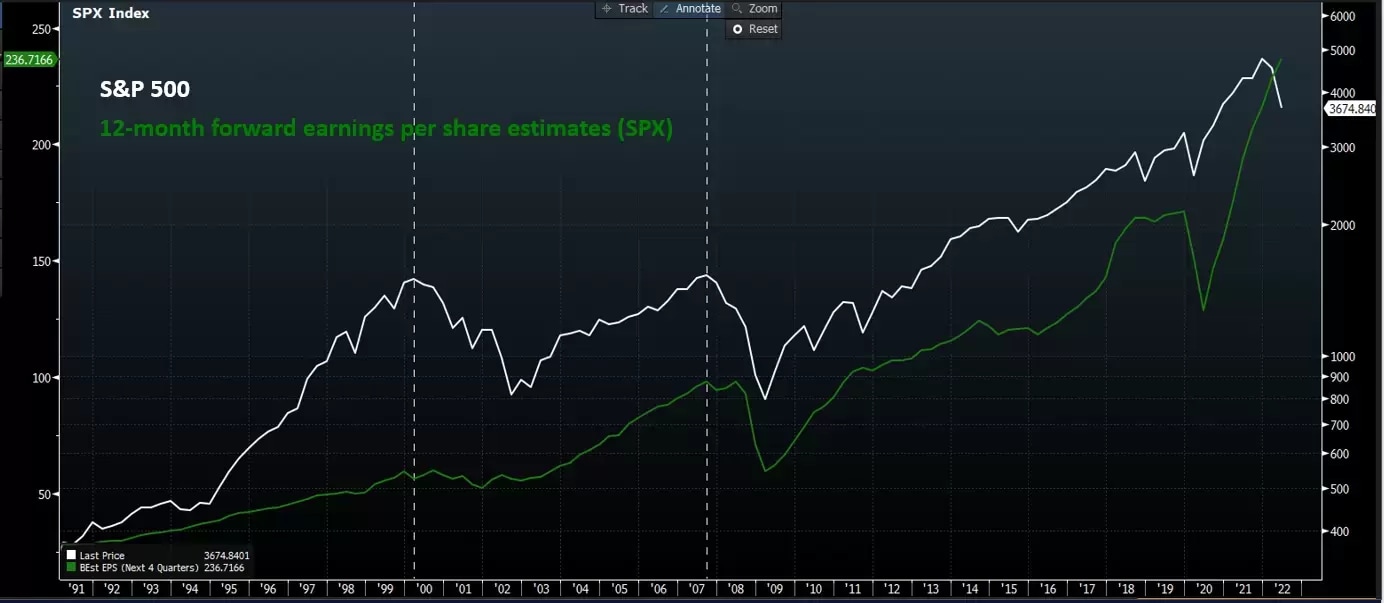
Secondly, the aggregate 12-month forward earnings per share estimate on the component stocks of the S&P 500 is still at a rosy level which suggests a significant risk of downside reversion because fundamental factors are likely to show clearer signs of deterioration in the later part of 2022.
Next up, we will discuss and explore further the impact of these key emerging macro factors on the US equities sectors, Australian equities, and China stock market.
Click here to read Part 2 & here for Part 3
Disclaimer: CMC Markets is an order execution-only service. The material (whether or not it states any opinions) is for general information purposes only, and does not take into account your personal circumstances or objectives. Nothing in this material is (or should be considered to be) financial, investment or other advice on which reliance should be placed. No opinion given in the material constitutes a recommendation by CMC Markets or the author that any particular investment, security, transaction or investment strategy is suitable for any specific person. The material has not been prepared in accordance with legal requirements designed to promote the independence of investment research. Although we are not specifically prevented from dealing before providing this material, we do not seek to take advantage of the material prior to its dissemination.


