Gold (update) – Medium-term uptrend intact supported by declining forward US real yield
Short to medium-term technical analysis


Time stamped: 25 Feb 2022 at 12:20pm SGT
Source: CMC Markets & TradingView
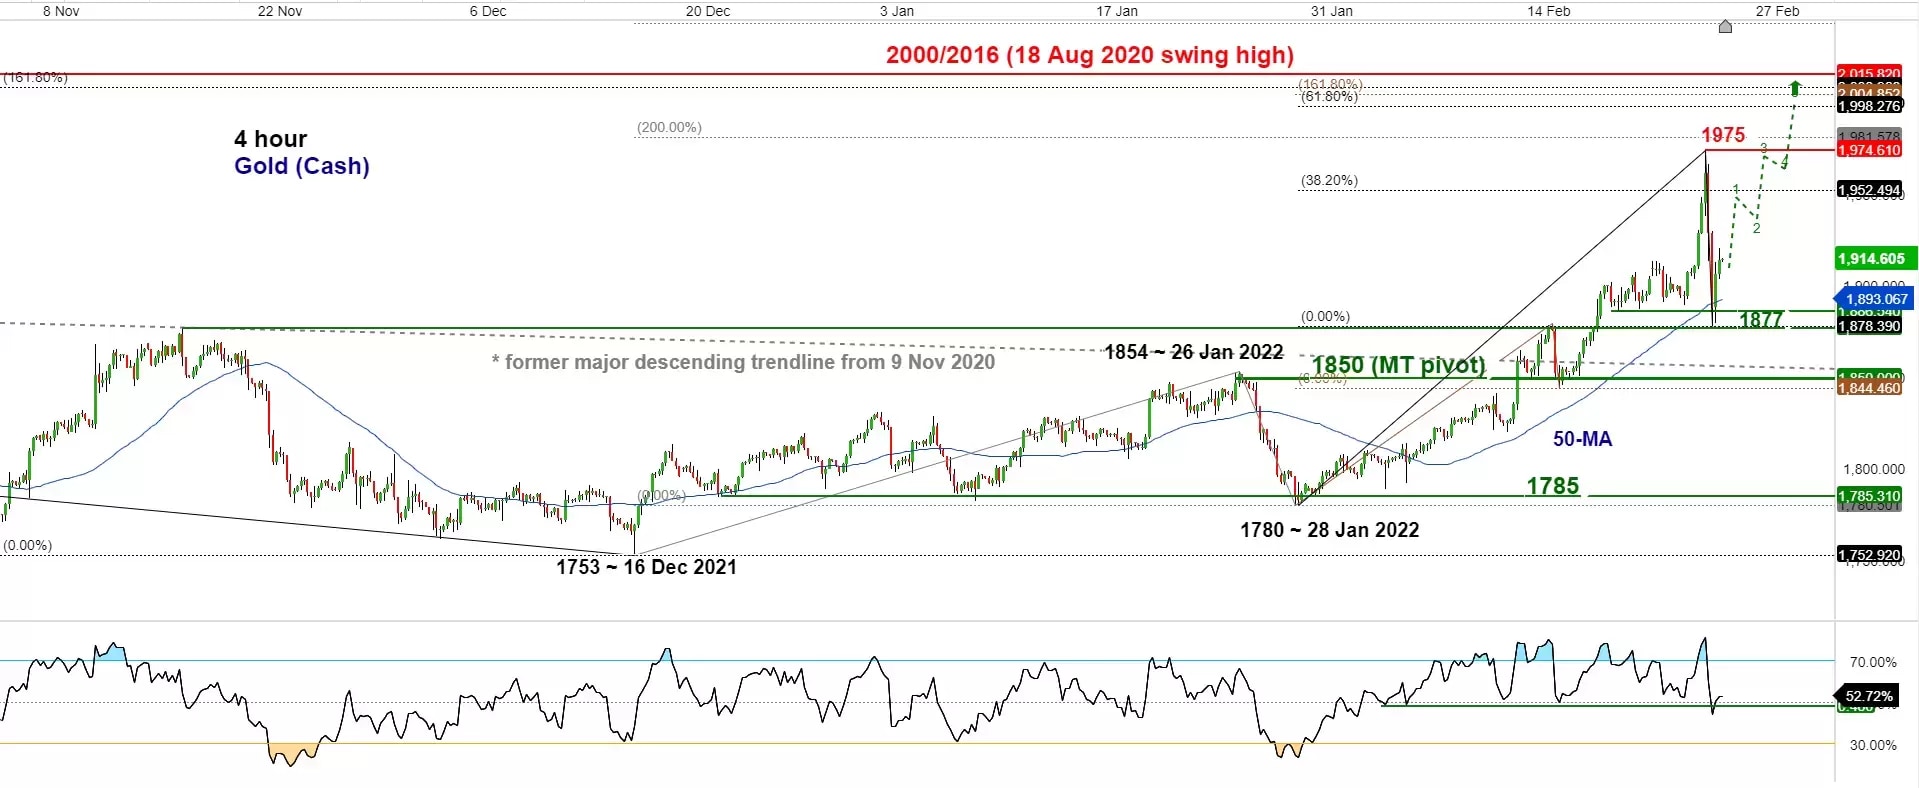
- In our latest “Chart of Week” published on 20 February (click here for a recap), Gold (cash) has rallied as expected and hit the resistance/target zone of 1,943/1,948 (printed a high of 1,975 on 24 February) in light of the rising geopolitical risk from Russia-Ukraine crisis.
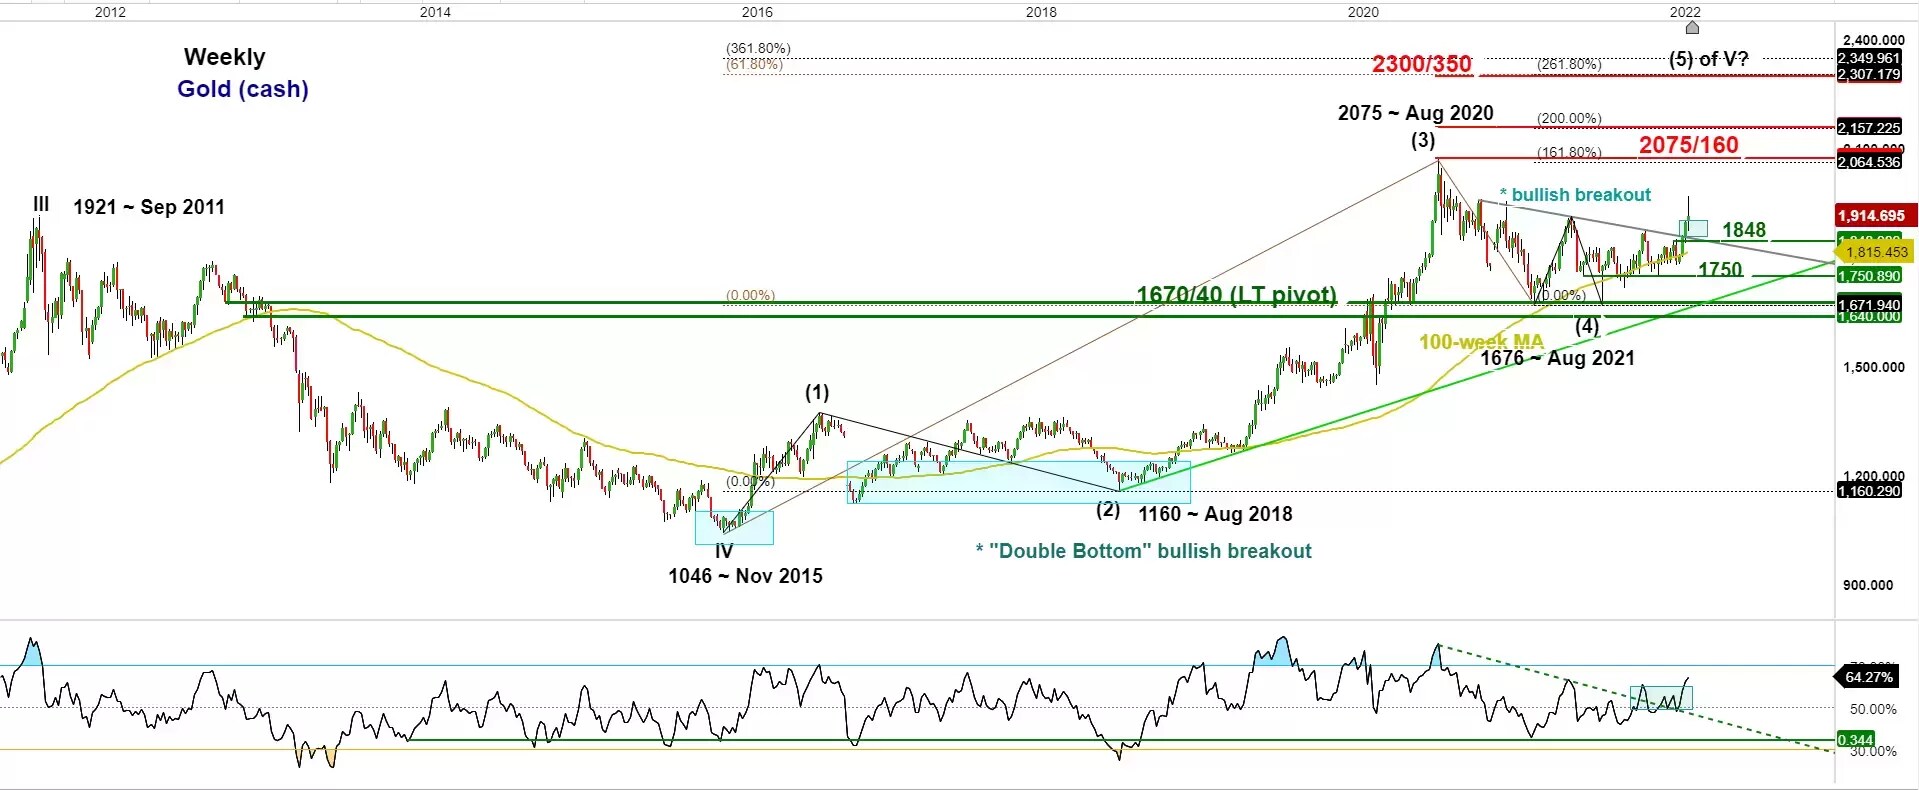
- The longer-term secular view (multi-months to multi-years) of Gold (cash) remains bullish if the 1,670/1,640 key long-term pivotal support holds. Elliot Wave/fractal analysis suggests a potential terminal level of 2,300/2,335 (see weekly chart).
- From a medium-term horizon (1 to 3 weeks), yesterday’s pull-back of -5% during the US session from its 1,975 intraday high has managed to stall at the 50-period moving average, the swing area of 18 February 2021 and 50% Fibonacci retracement of the recent up move from 28 January 2022 low to 24 February 2022 high.
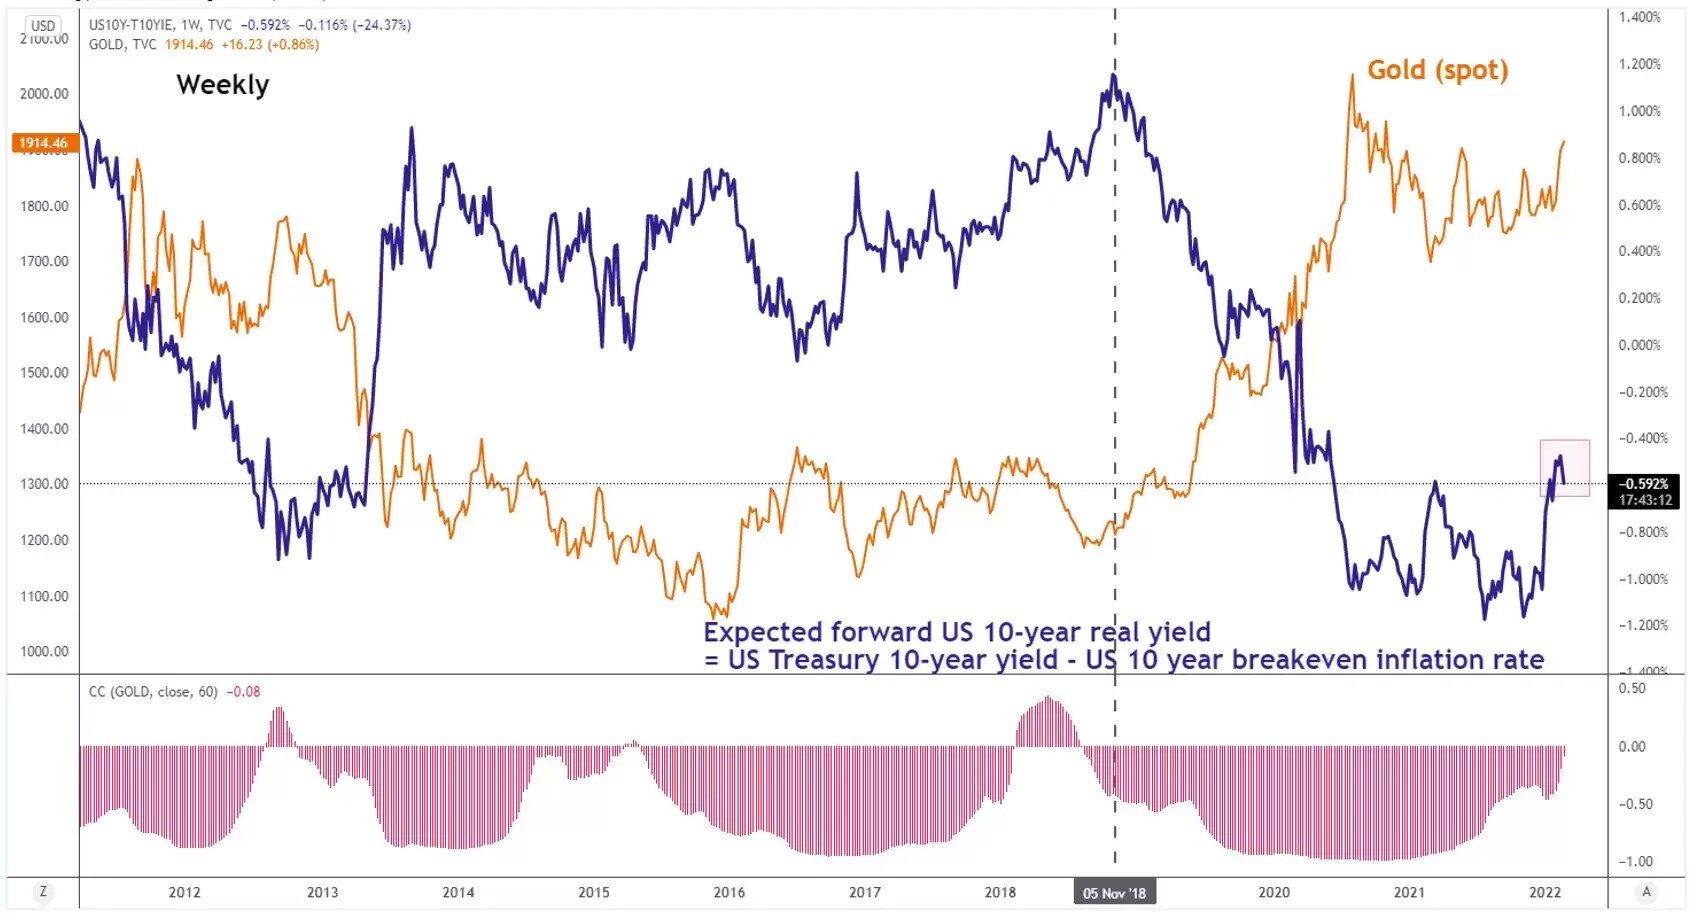
- From an intermarket analysis perspective, the price actions of Gold (spot) have moved inversely with the movement of the expected forward US 10-year Treasury real yield since early November 2018 where we consider the future expectations of the US 10-year inflation via the 10-year breakeven inflation rate.
- Since mid-February 2022, the expected forward US 10-year Treasury real yield has stared to inch downwards which can be a significant factor to support further potential up move in the price of Gold (spot).
- Hence, its medium-term uptrend phase remains intact and if 1,850 key medium-term pivotal support holds, Gold (cash) may see another potential impulsive up move sequence to retest 1,1975 before targeting the next resistance zone at 2,000/2,016 (see 4-hour chart).
- On the other hand, a 4-hour close below 1,850 negates the bullish tone for a deeper corrective pull-back towards the next support at 1,785 (the range bottom of 21 December 2021 to 28 January 2022.
Disclaimer: CMC Markets is an order execution-only service. The material (whether or not it states any opinions) is for general information purposes only, and does not take into account your personal circumstances or objectives. Nothing in this material is (or should be considered to be) financial, investment or other advice on which reliance should be placed. No opinion given in the material constitutes a recommendation by CMC Markets or the author that any particular investment, security, transaction or investment strategy is suitable for any specific person. The material has not been prepared in accordance with legal requirements designed to promote the independence of investment research. Although we are not specifically prevented from dealing before providing this material, we do not seek to take advantage of the material prior to its dissemination.


