By John Sheridan
Gold is a long way from its high of 1921 per ounce back in 2011. But it is catching my eye right now. As we can see from the chart below, the monthly downtrend has come to an end, with price having put in both a higher high and higher low, though this is offset slightly by the sideways price action over recent monthly candles.
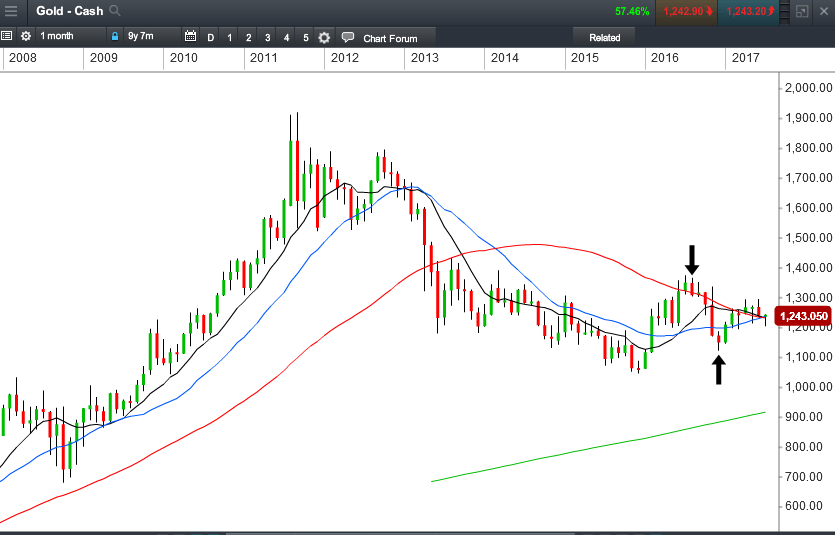
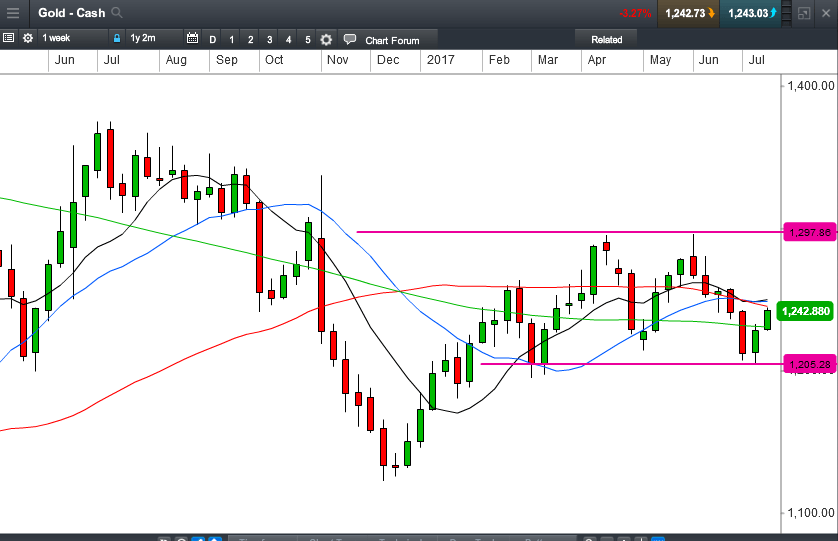
Traders often choose to be aware of the long-term and to align themselves with it where possible. So far the long-term view on Gold is concerned, if I were an investor I wouldn’t be rushing out to purchase any physical bullion. But nor would I be looking to sell any that I had already buried at the bottom of the garden. Let’s consider the shorter-term possibilities and I do see possibilities right now in Gold.
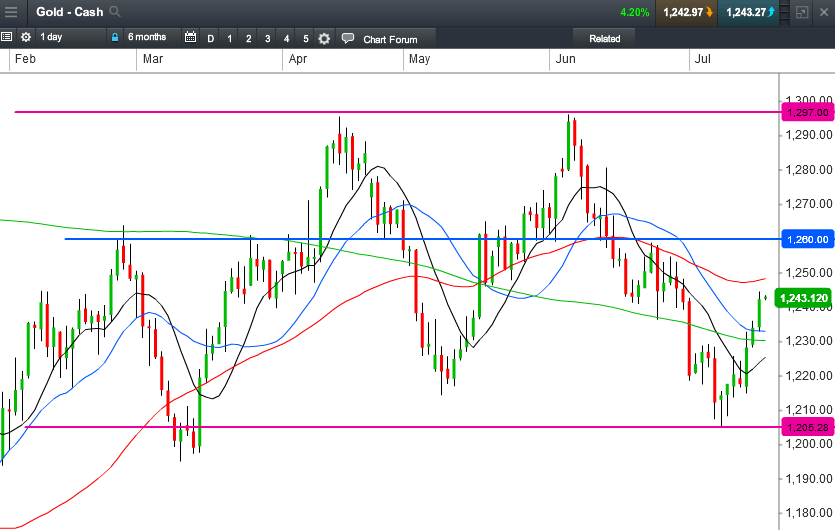
Moving down to the daily chart, we can see that this price action looks to be ranging smoothly and, having found support just above the 1,200 level, price has bounced off it and the momentum is clearly upwards. However, we do need to be mindful of resistance around the 1,260 level.
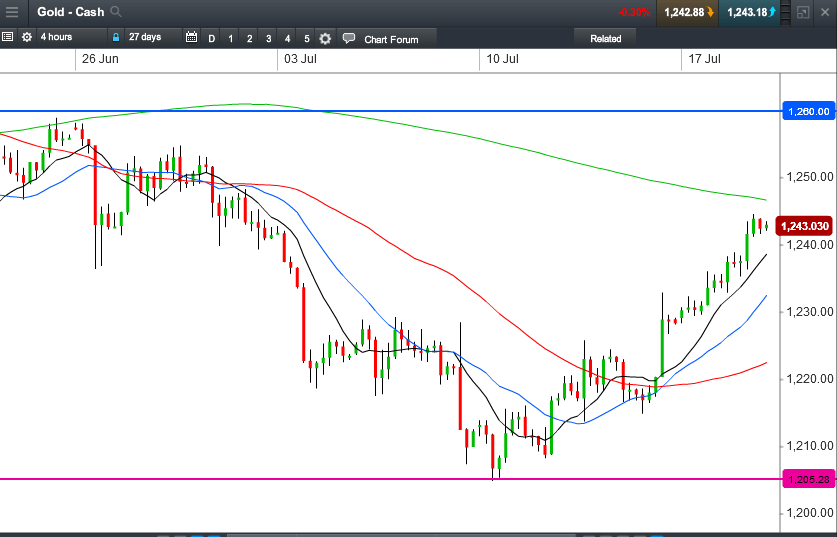
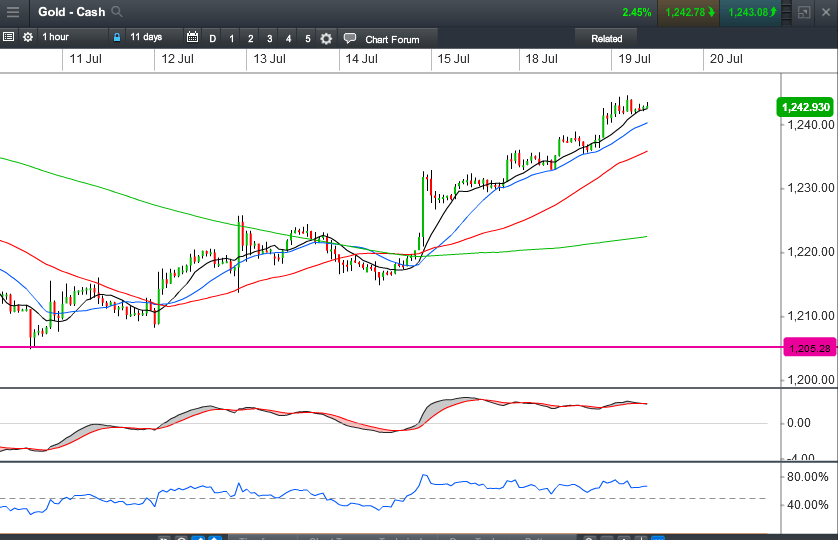
And this for me is where the real opportunity looks to be right now. On the hourly chart, we can see a clean, flowing uptrend, all four moving averages showing the correct geometry. The trend has been confirmed with indicator convergence and price continually pulling back to the moving averages before taking the next leg up.
I am looking for trade setups when price pulls back to the moving average buy zone and will either look to close before the 1,260 level or, if possible, trail my stops up to lock in profit and look for a move towards 1,300.
So for me right now, as an investor it’s a Gold shrug, but as a shorter term trader, I am a Gold bug.
Disclaimer: CMC Markets is an order execution-only service. The material (whether or not it states any opinions) is for general information purposes only, and does not take into account your personal circumstances or objectives. Nothing in this material is (or should be considered to be) financial, investment or other advice on which reliance should be placed. No opinion given in the material constitutes a recommendation by CMC Markets or the author that any particular investment, security, transaction or investment strategy is suitable for any specific person. The material has not been prepared in accordance with legal requirements designed to promote the independence of investment research. Although we are not specifically prevented from dealing before providing this material, we do not seek to take advantage of the material prior to its dissemination.


