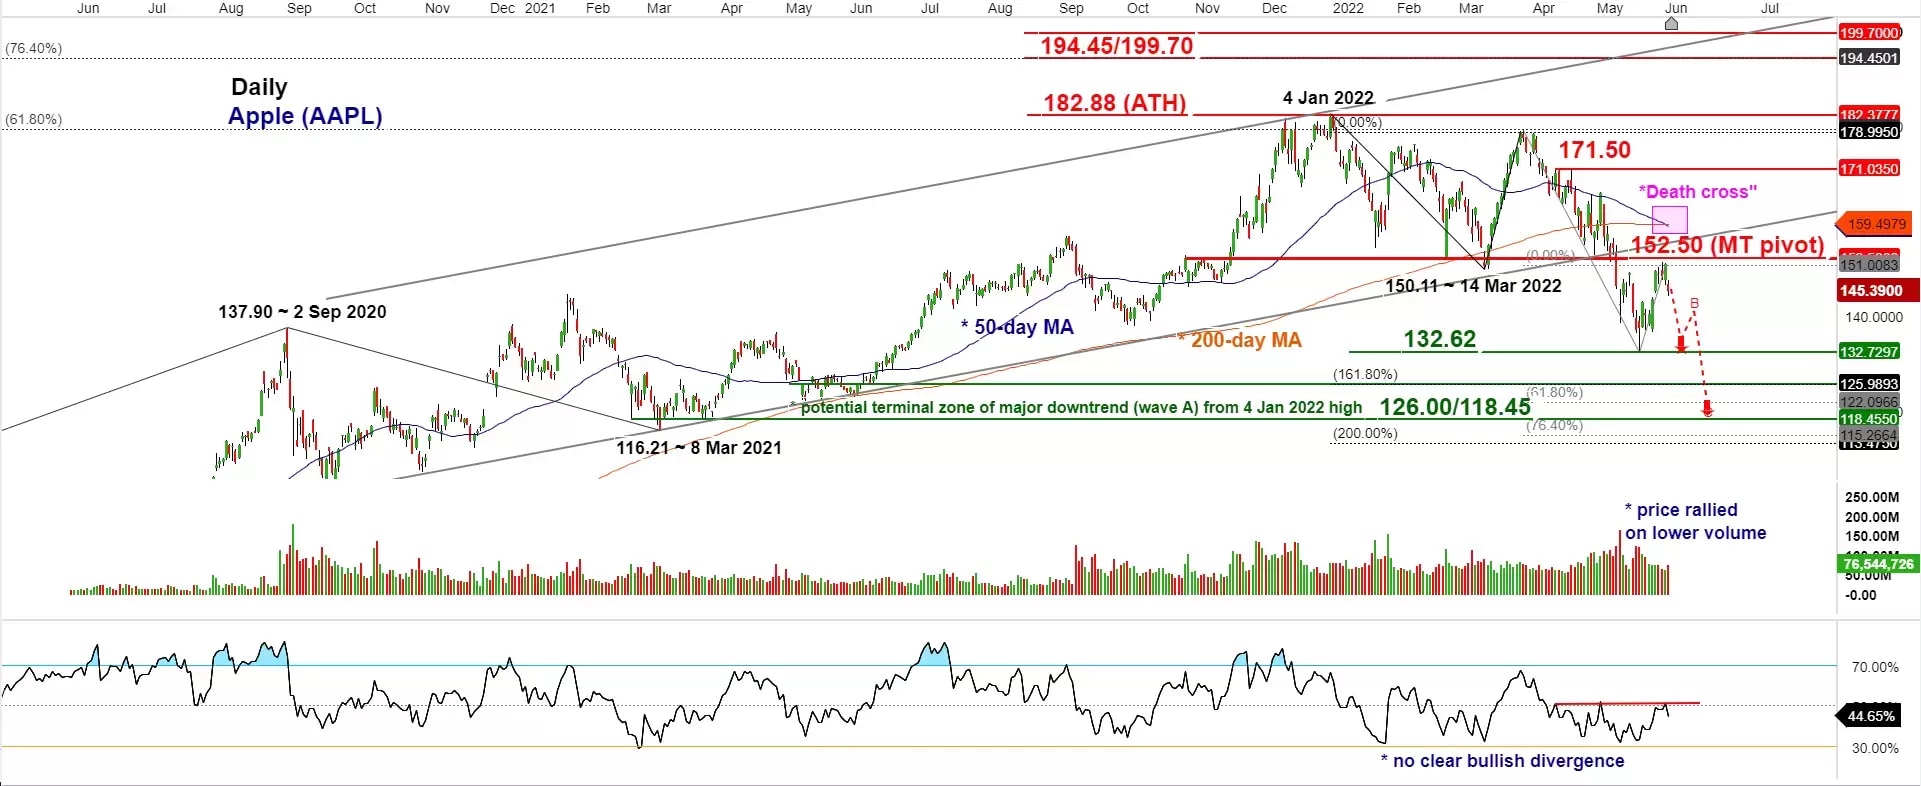
Chart of the week – Apple
“Death cross” on Apple ahead of WWDC 2022
Medium-term technical analysis (1 to 3 months)

Source: CMC Markets
- Apple Inc will hold its annual Worldwide Developers Conference 2022 next week from Monday (6 June) to Friday (10 June). New updates are likely to be announced for iOS/iPad OS, macOS and watchOS. The focus for market participants is whether there will be a release of mixed reality development tools for its combo AR/VR (augmented reality/virtual reality) wearable headset, a future key revenue stream for Apple.
- From a technical analysis perspective, the recent price actions of Apple (AAPL) do not look promising to advocate a bullish view that we have reached reach a major bottoming process on 20 May 2022 that kickstarts a new impulsive up move sequence for a new all-time high.
- Bearish bias below 152.50 key medium-term pivotal resistance for another potential impulsive down move sequence within its major down trend phase in place since 4 January 2022 high to retest the recent 20 May low of 132.62 and a break below it may see a further potential drop towards the key support zone of 126.00/118.45.
- On the other hand, a clearance with a daily close above 152.50 invalidates the bearish scenario for an extension of the corrective rebound from 20 May 2022 low towards the next resistance at 171.50 (also 76.4% retracement of the down move from 4 January 2022 high to 20 May 2022 low).
- Based on Elliot Wave/fractal analysis, the 126.00/118.45 key support zone may see the end/terminal point for first leg of the multi-month major down trend phase (wave A) from 4 January 2022 high. Thereafter, a possible multi-month (1 to 3 months) corrective rebound/consolidation (Wave B) may occur to retrace a portion of the prior major downtrend.
- Bearish elements; the recent rebound of 14.4% from 20 May 2022 low to 1 June 2022 high has been accompanied by lower/declining volume, the first sighting of a “Death cross” signal (50-day moving average below 200-day moving average) since its prior major uptrend phase that kickstarted from 23 March 2020 low, the daily RSI oscillator has staged a bearish reaction right after a retest on its key corresponding resistance at the 51% level which suggests medium-term downside momentum of price actions remains intact.
Disclaimer: CMC Markets is an order execution-only service. The material (whether or not it states any opinions) is for general information purposes only, and does not take into account your personal circumstances or objectives. Nothing in this material is (or should be considered to be) financial, investment or other advice on which reliance should be placed. No opinion given in the material constitutes a recommendation by CMC Markets or the author that any particular investment, security, transaction or investment strategy is suitable for any specific person. The material has not been prepared in accordance with legal requirements designed to promote the independence of investment research. Although we are not specifically prevented from dealing before providing this material, we do not seek to take advantage of the material prior to its dissemination.


